
o11ybot
Mobile Observability Companion
A SwiftUI iPhone application that connects to Elastic MCP Server endpoints to display synthetic monitoring, traces, metrics, and logs data—all in the palm of your hand.
Features
Everything you need for mobile observability
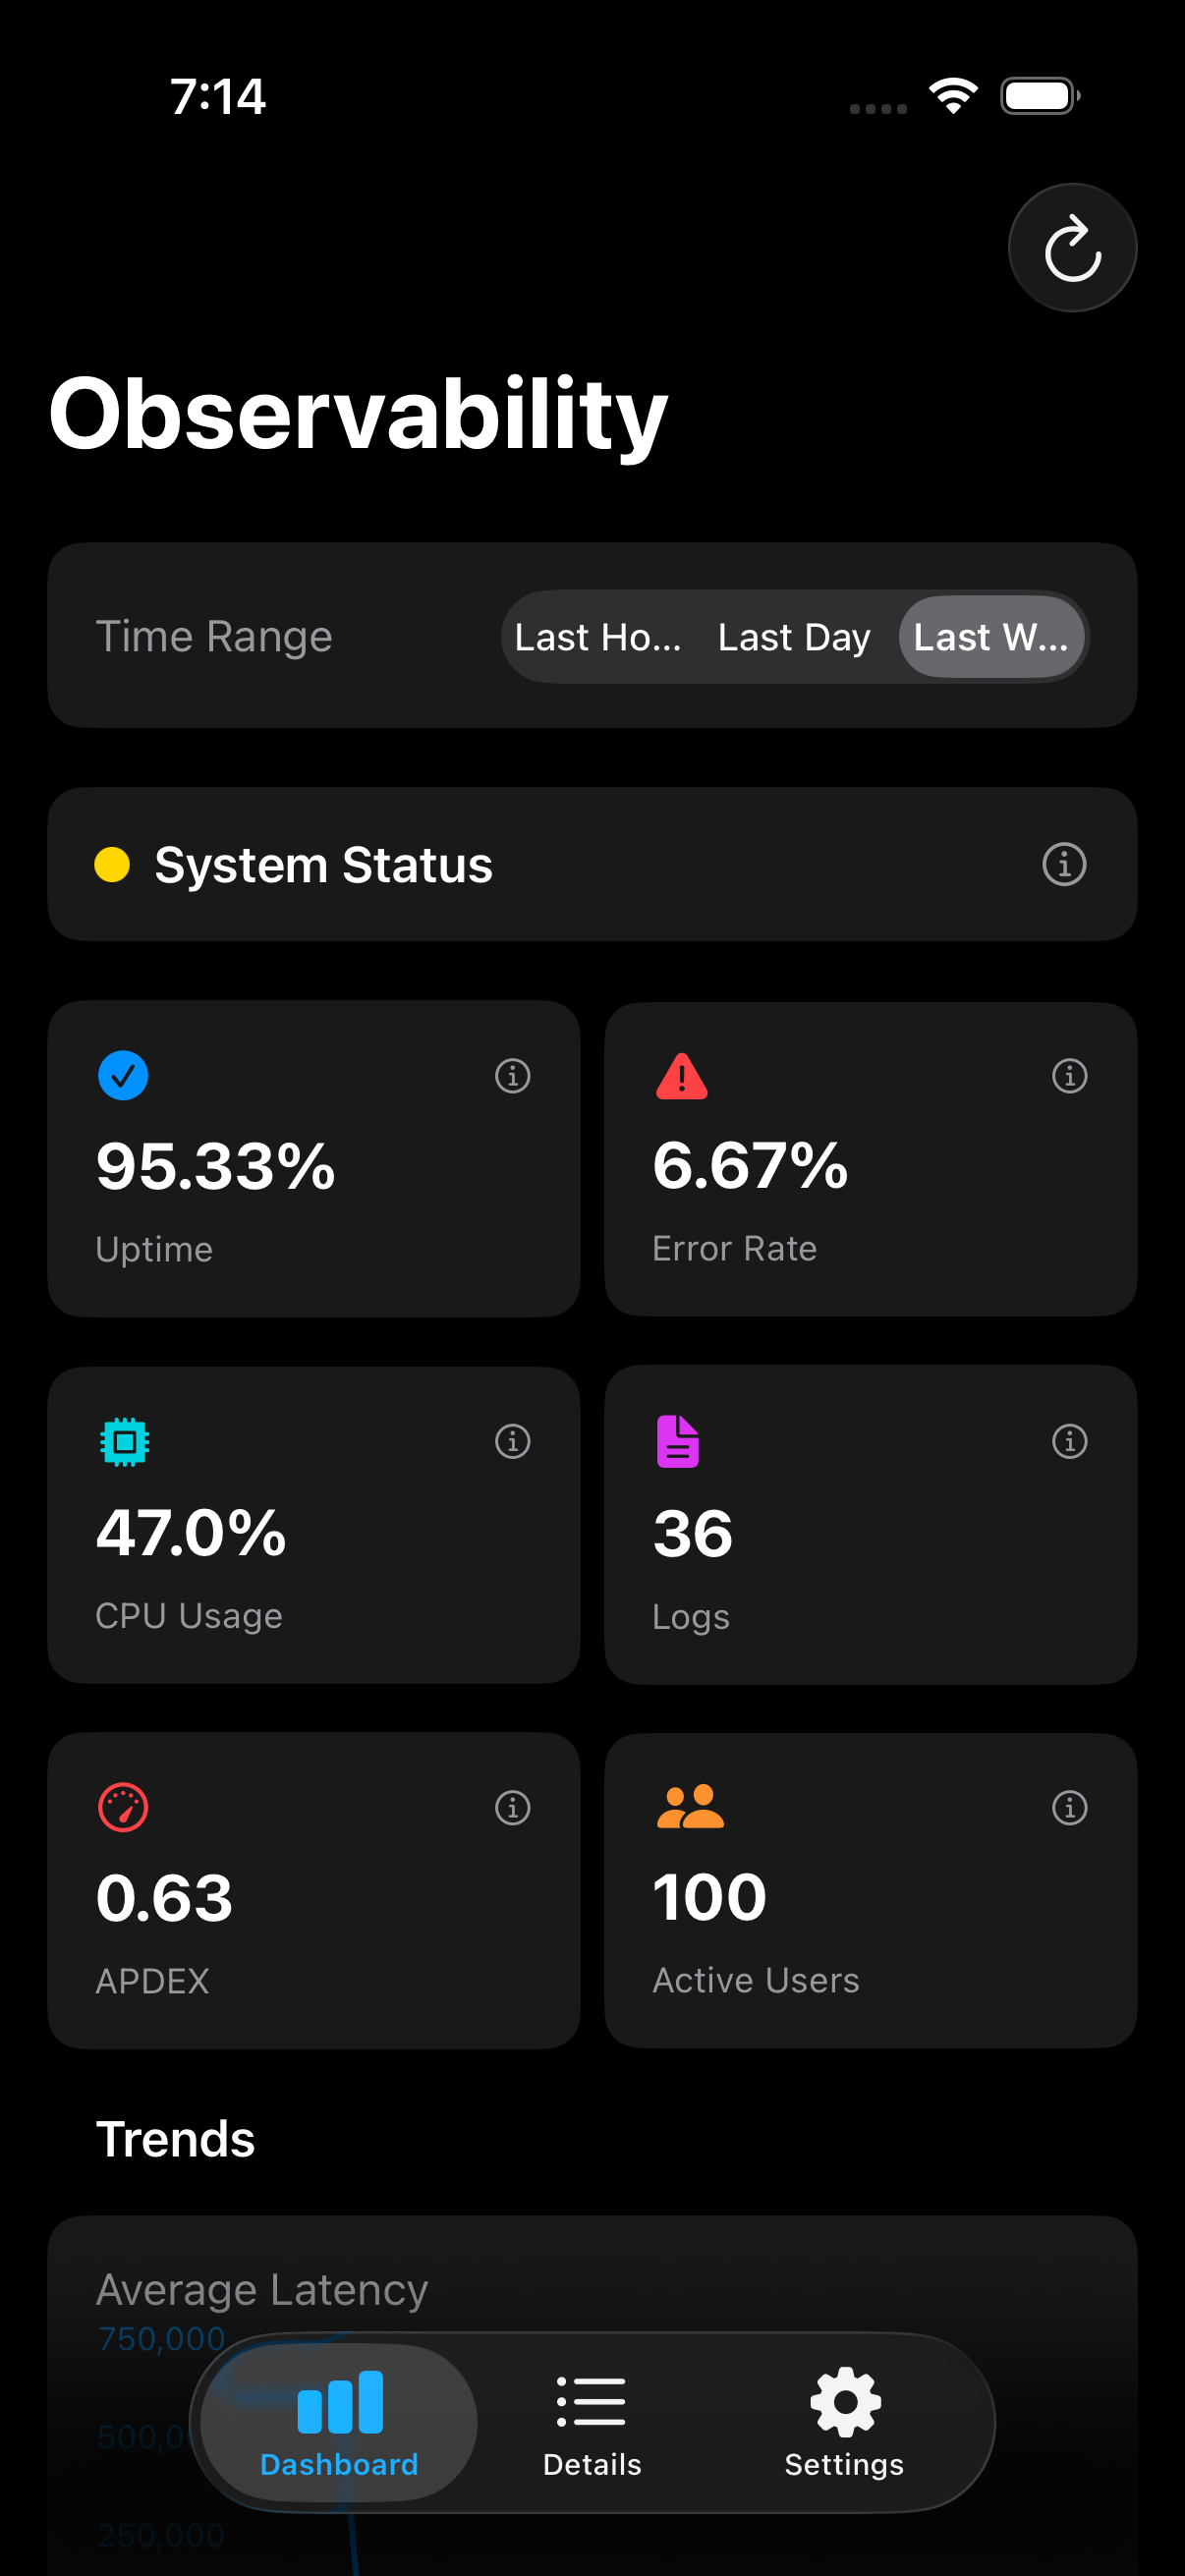
Dashboard View
Real-time health cards showing uptime, error rates, CPU usage, and log error counts with Swift Charts integration.
Click to learn more →
Details View
Drill-down interface for each data type—Synthetics, Traces, Metrics, Logs, and Workflows.
Click to learn more →
Auto-refresh
Configurable refresh interval (default 60 seconds) to keep your data up-to-date automatically.
Click to learn more →
Secure Storage
Keychain integration for secure credential storage of API endpoint and key.
Click to learn more →
Dark Theme
Elastic-style observability theme with blue, teal, and violet accents optimized for dark mode.
Click to learn more →
Real-time Data
Connects directly to Elastic MCP Server endpoints for live observability data.
Click to learn more →
Dashboard
Real-time observability at your fingertips
Monitor Everything
- •Synthetic monitoring status with uptime percentages
- •APM trace summaries and performance metrics
- •System metrics including CPU and memory usage
- •Recent error logs and slow traces
- •Workflow execution status and history
Detailed Views
Drill down into each observability domain
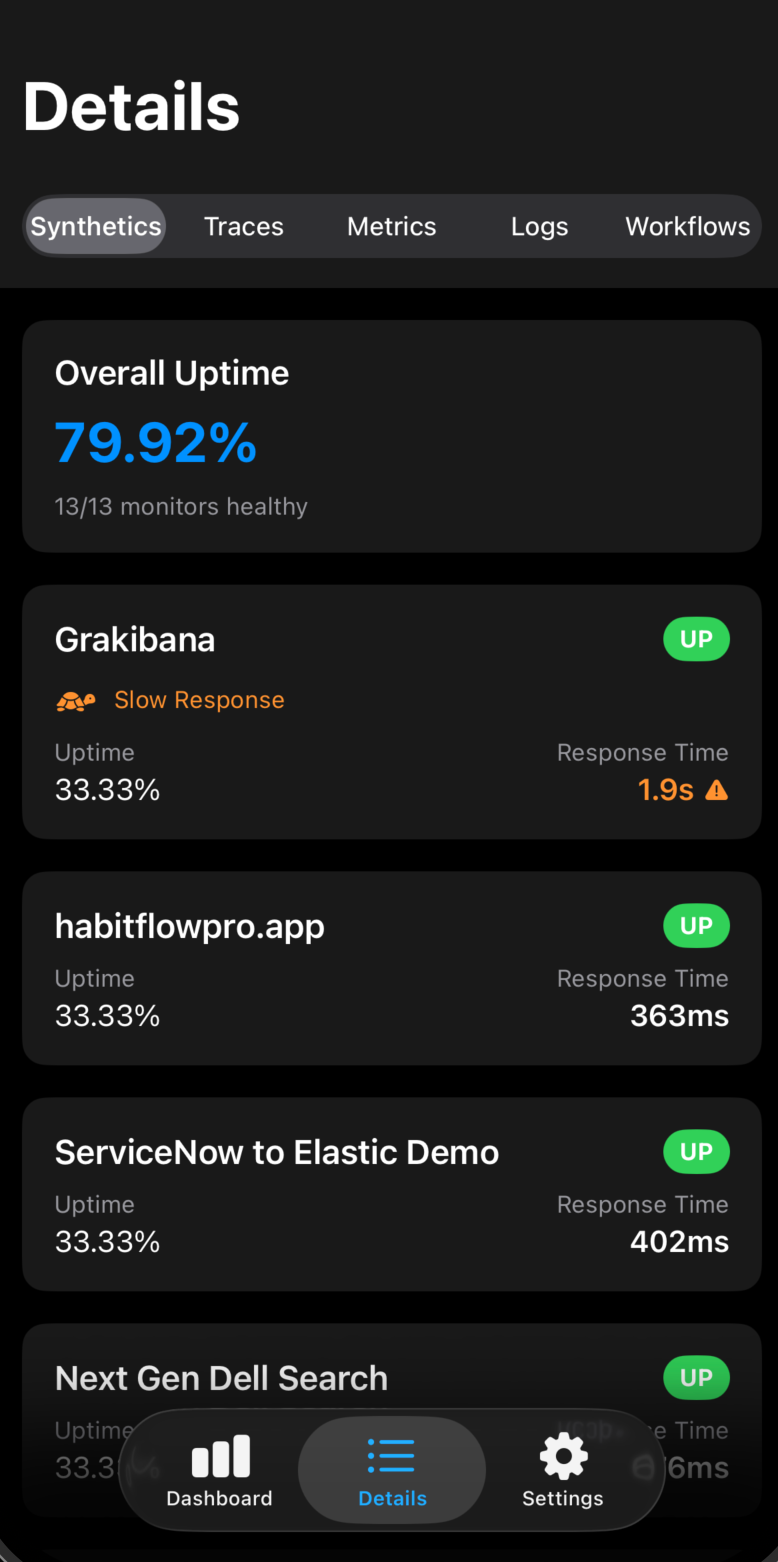
Synthetics
Monitor your synthetic checks with real-time status, response times, and uptime metrics.
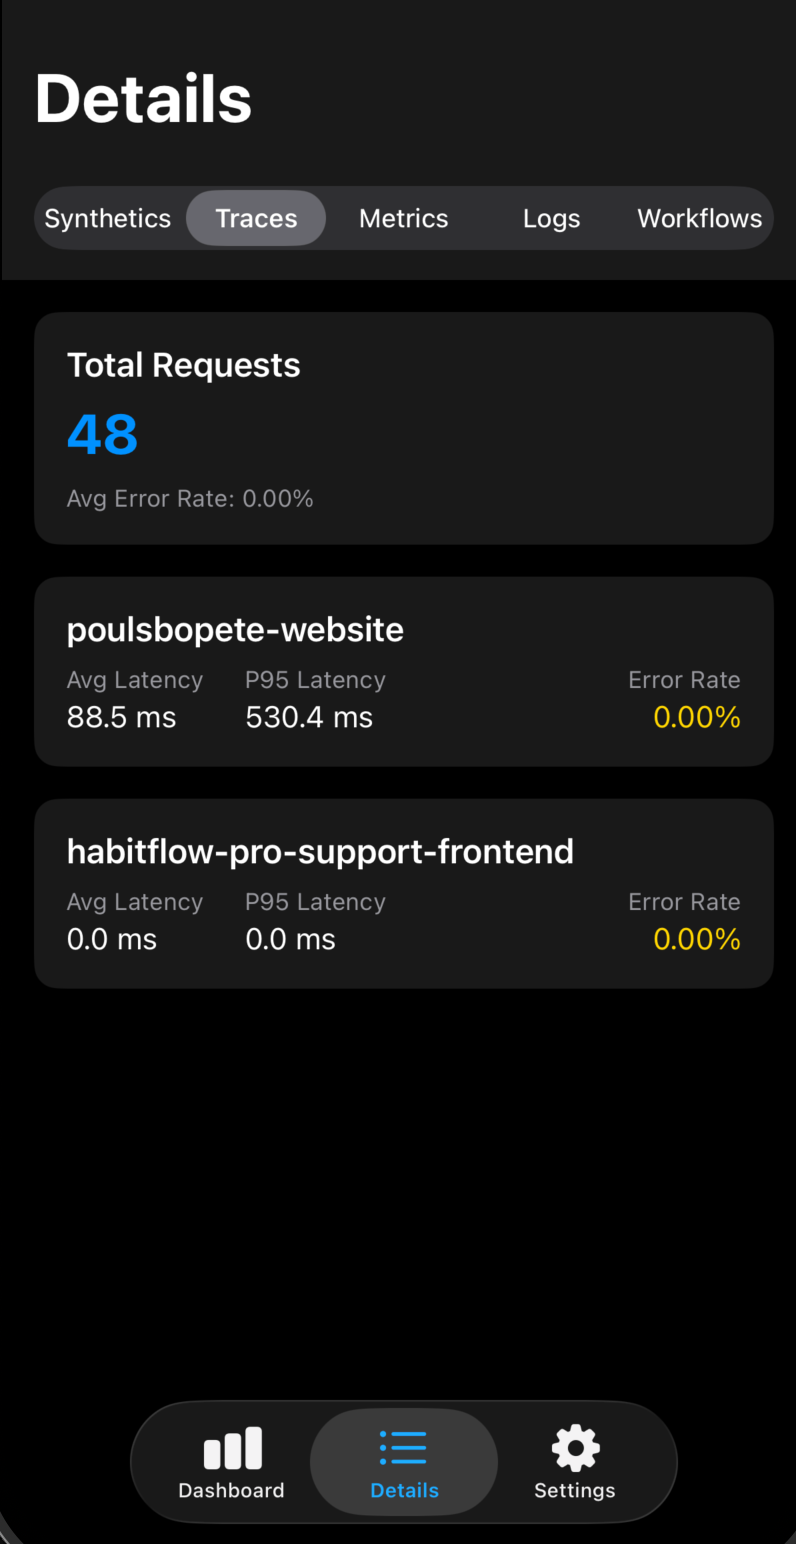
Traces
View APM trace summaries with performance insights and latency trends.
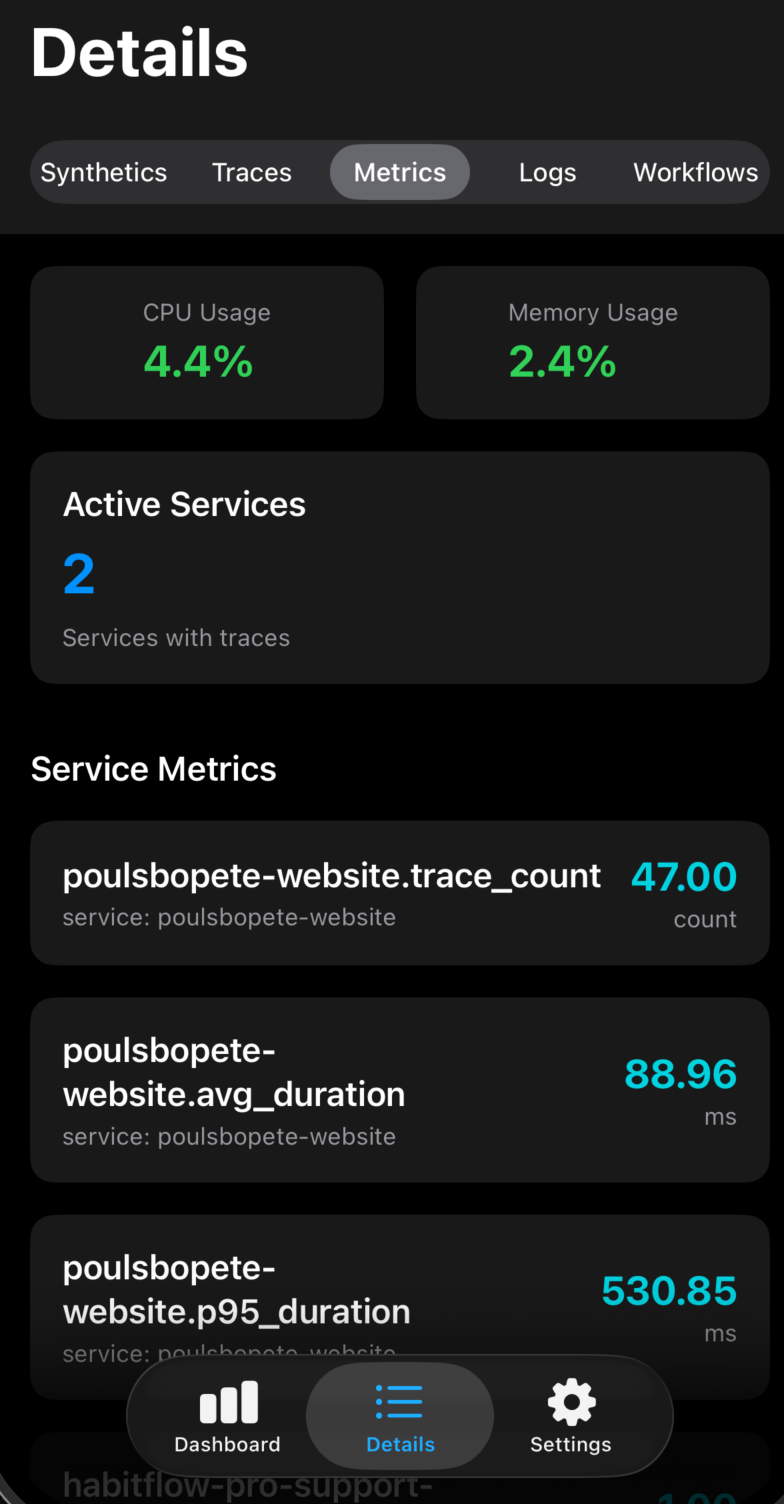
Metrics
Track system metrics including CPU usage, memory consumption, and service health.
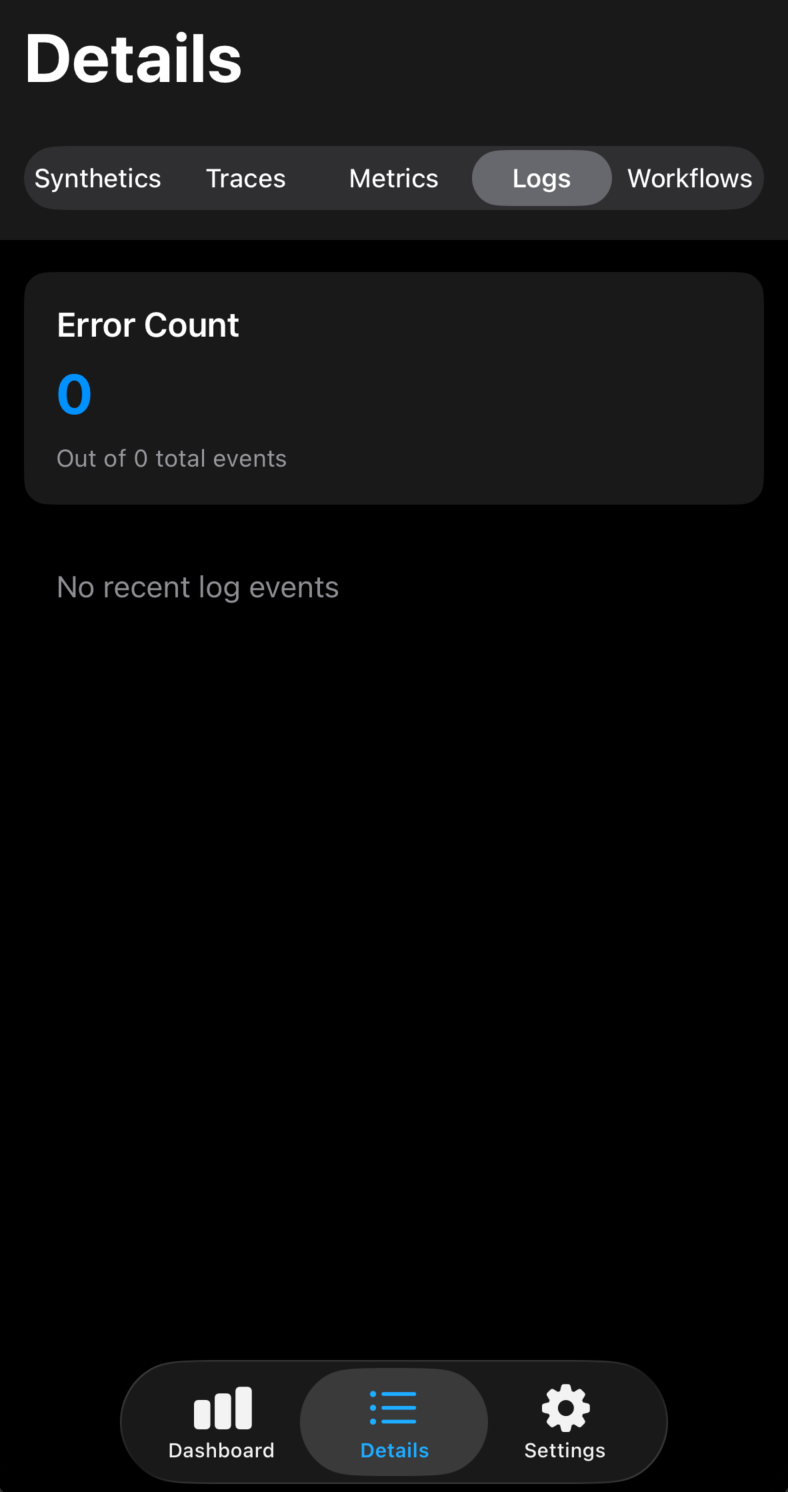
Logs
Browse recent error logs and slow traces to quickly identify issues.
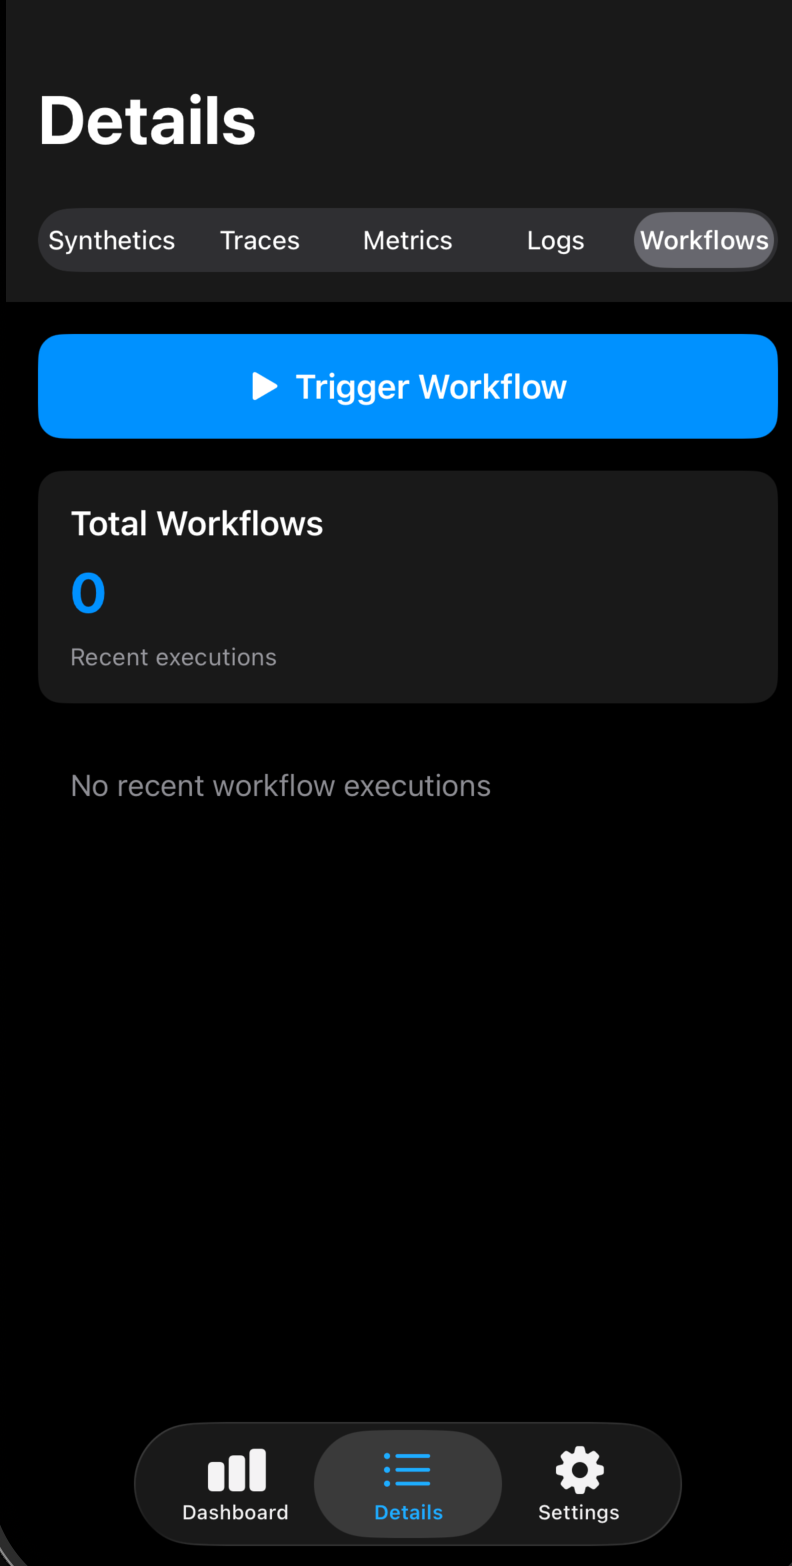
Workflows
Monitor workflow executions and trigger new workflows directly from your device.
Screenshots
Explore every feature of o11ybot
Dashboard
Real-time observability dashboard with interactive health cards showing uptime, error rates, CPU usage, and active users
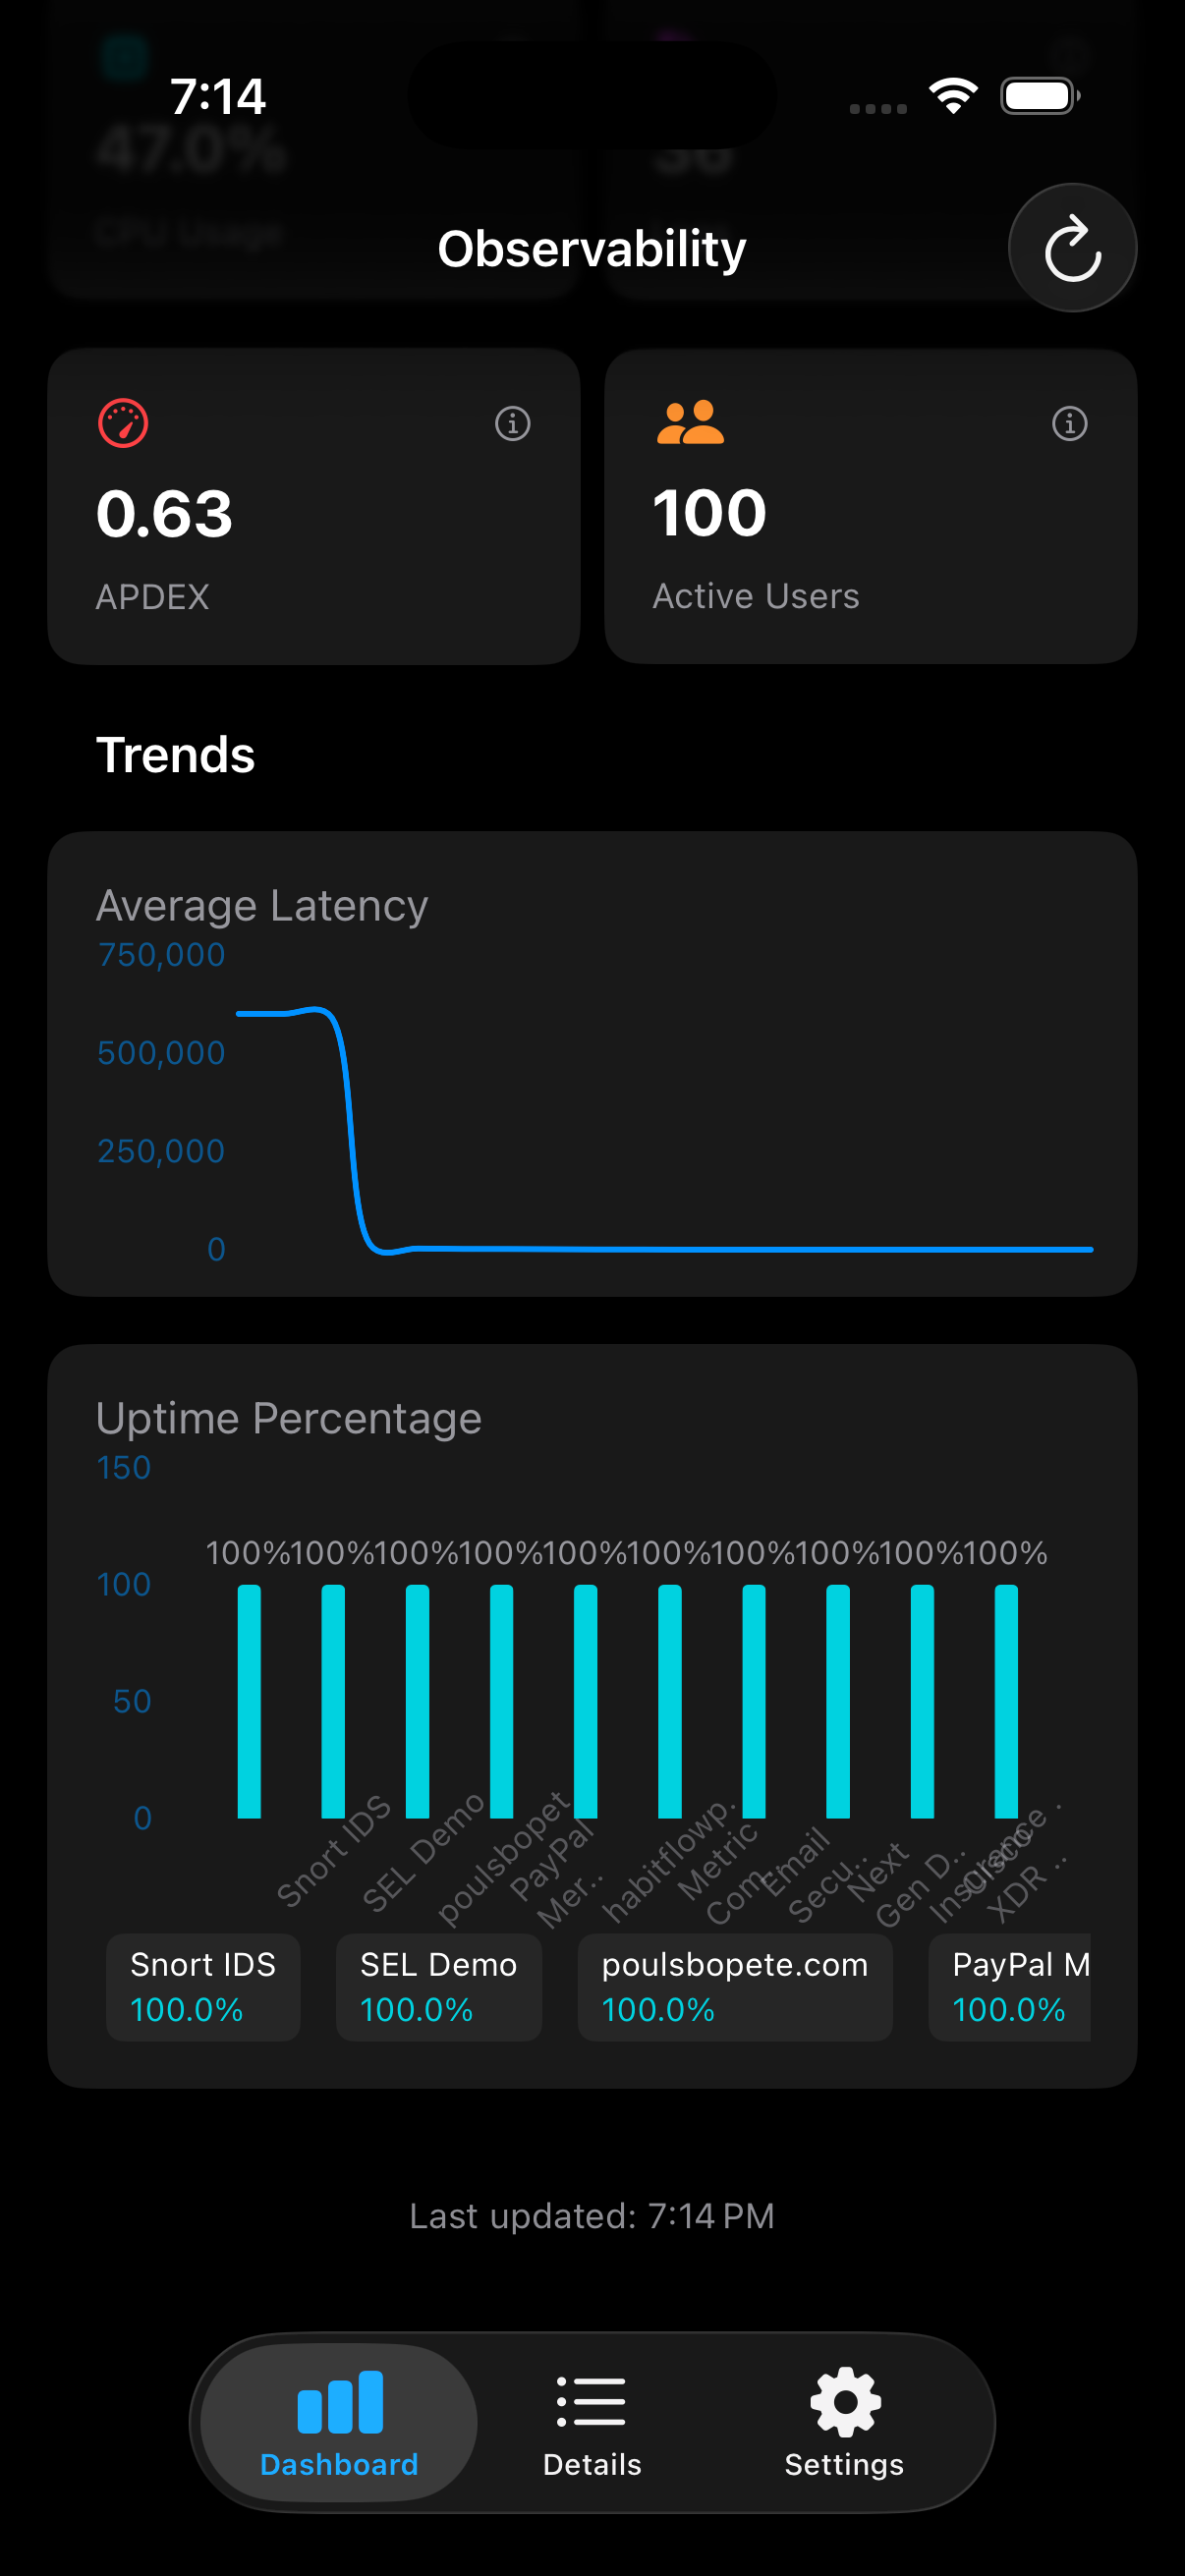
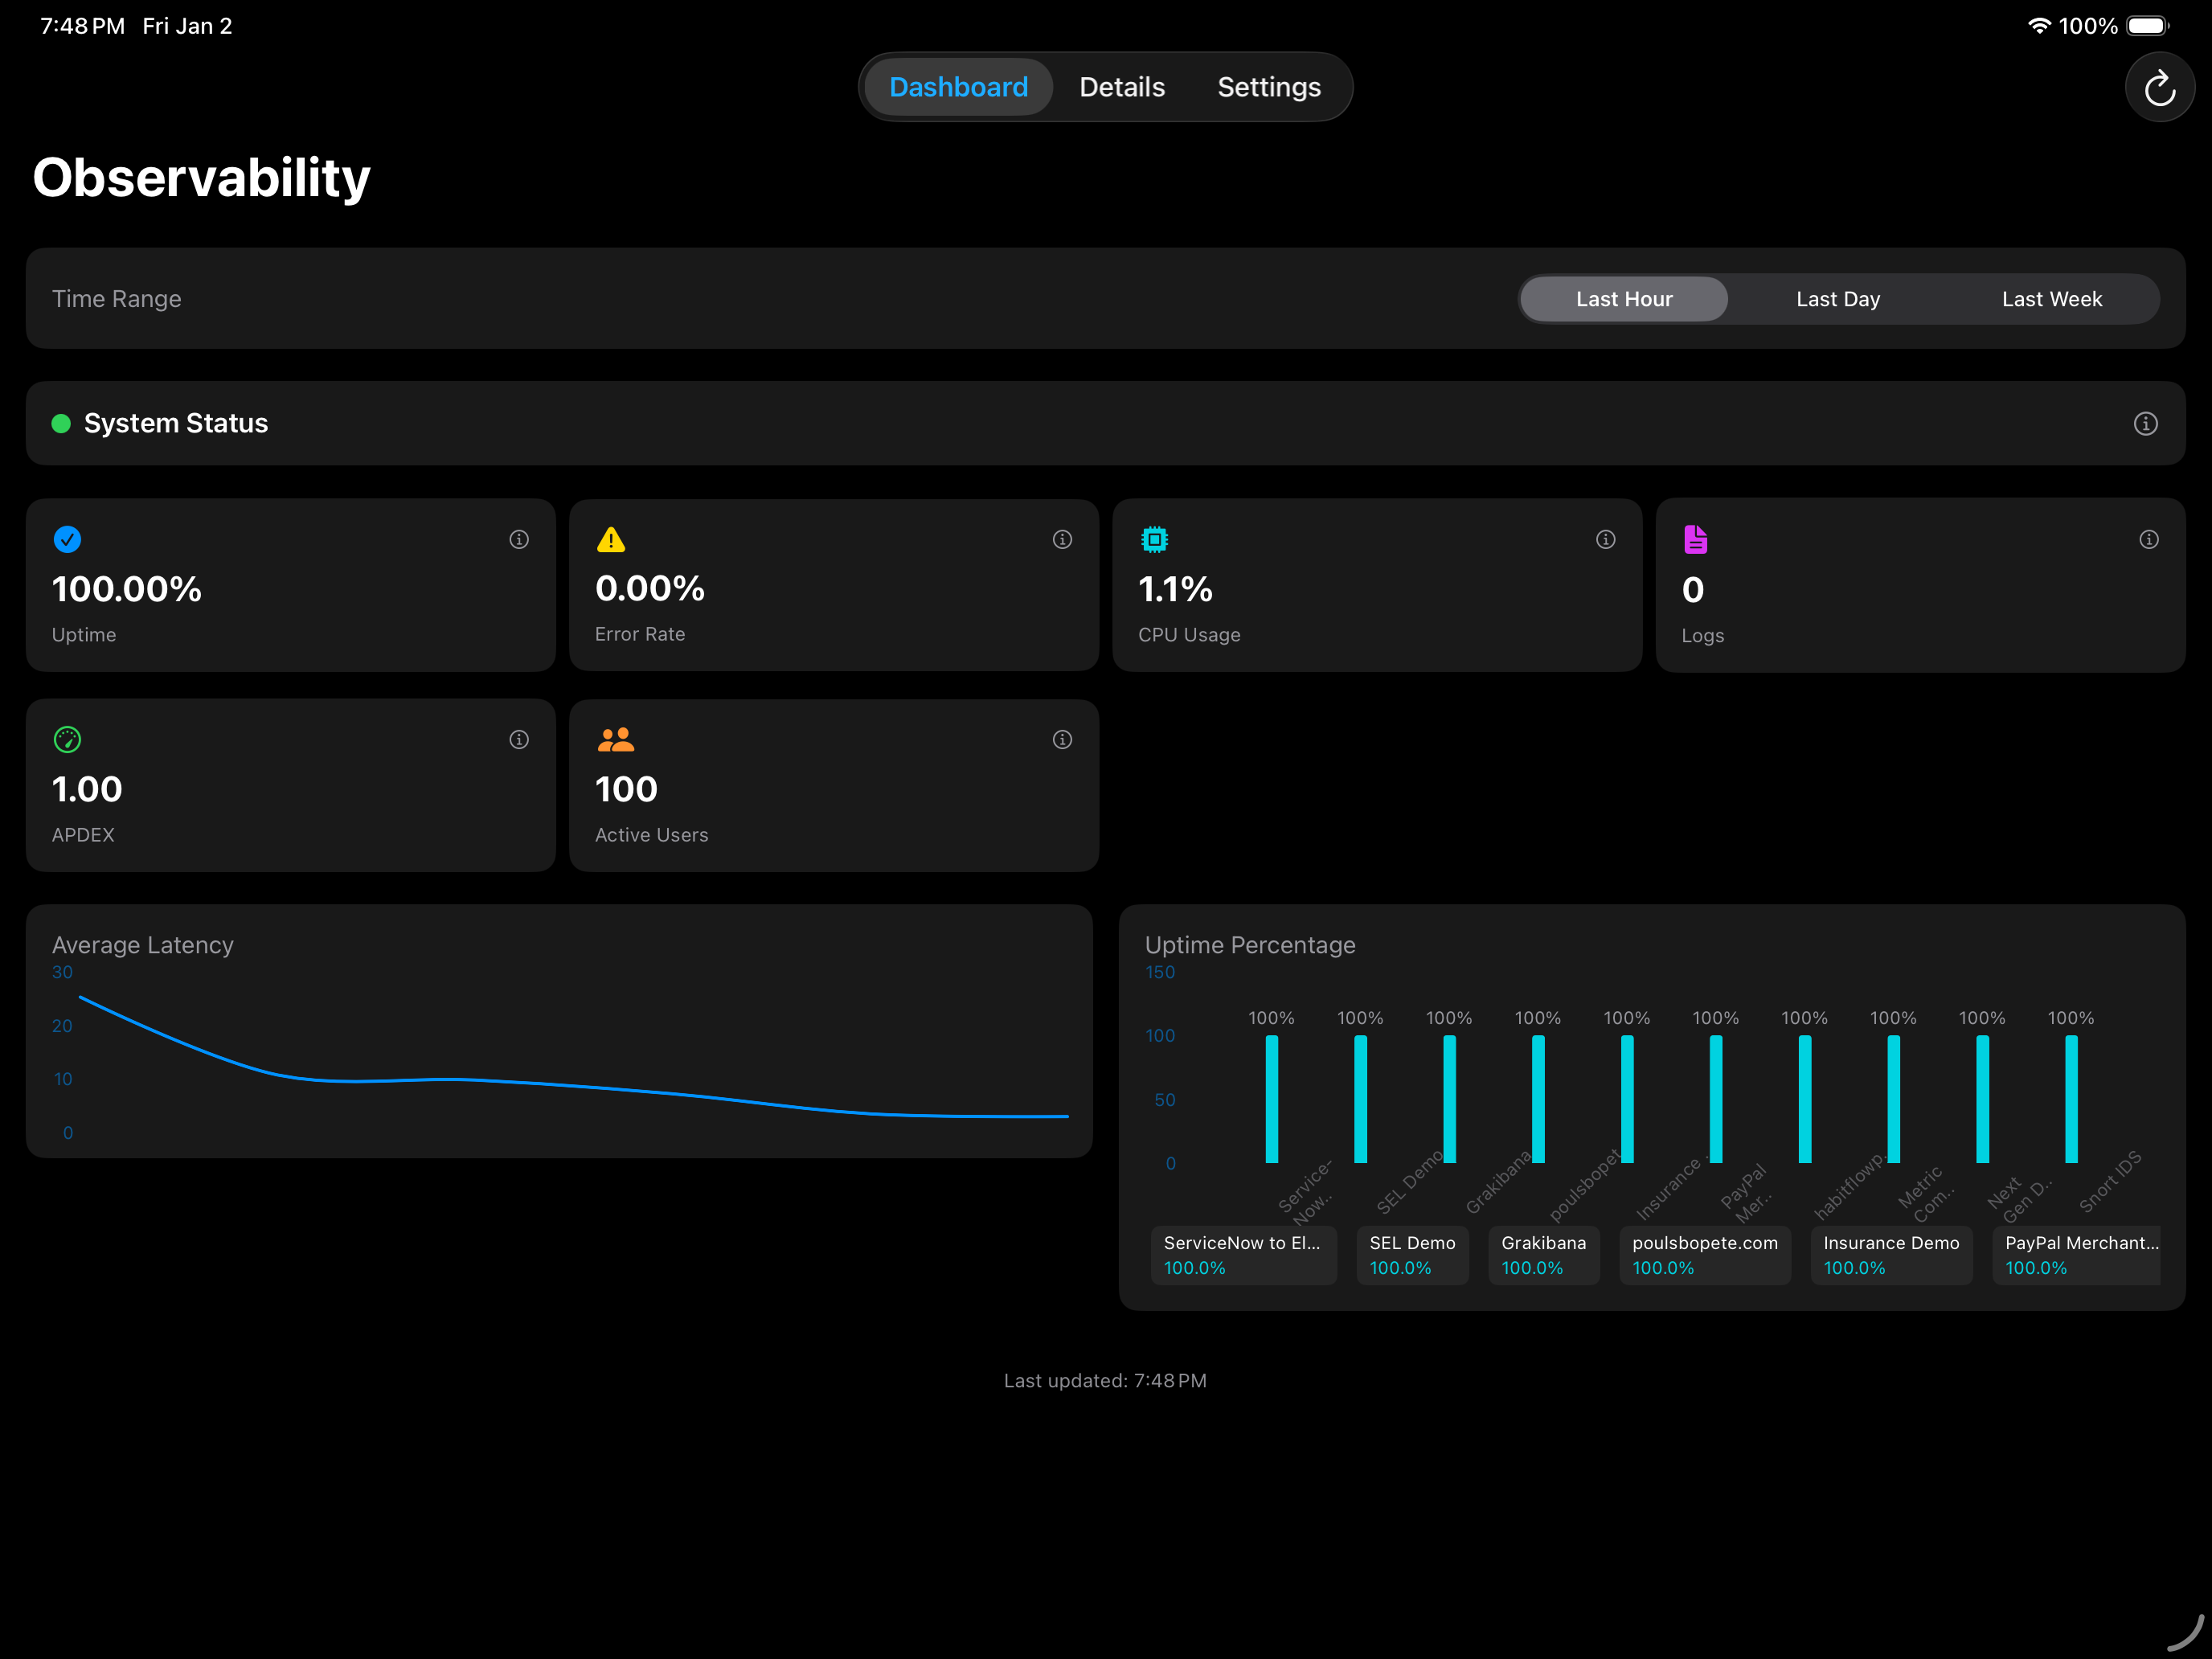
System Status
Detailed system status with APDEX score, active users, and comprehensive trend charts including latency and uptime
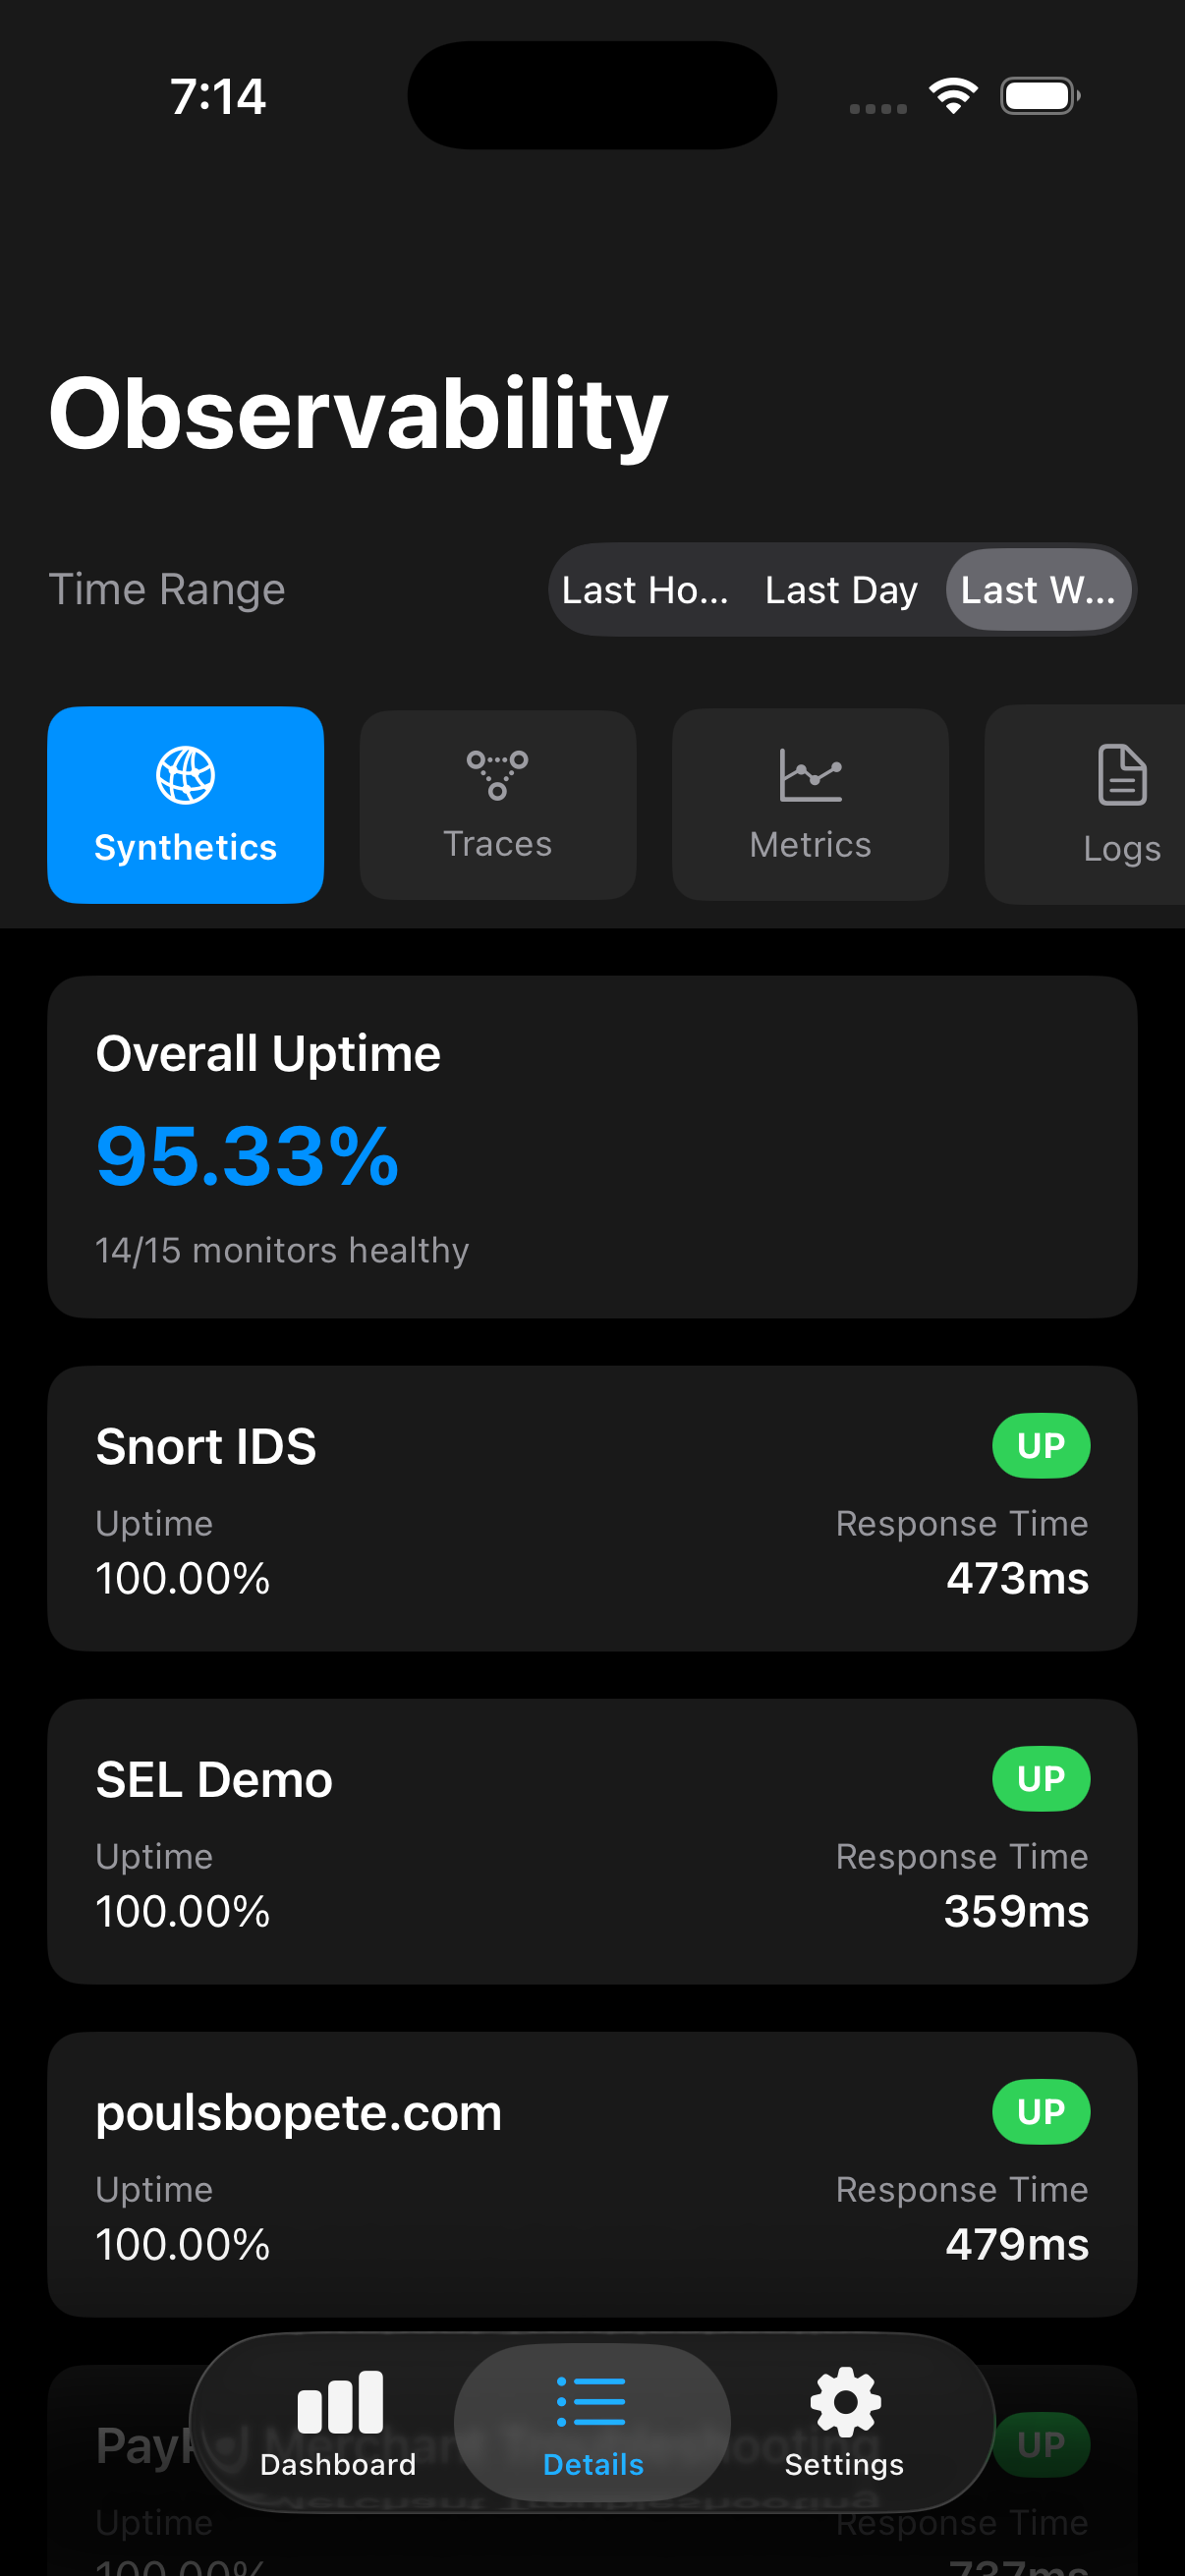
Synthetics Monitoring
Monitor synthetic checks with overall uptime percentage and individual endpoint status including response times
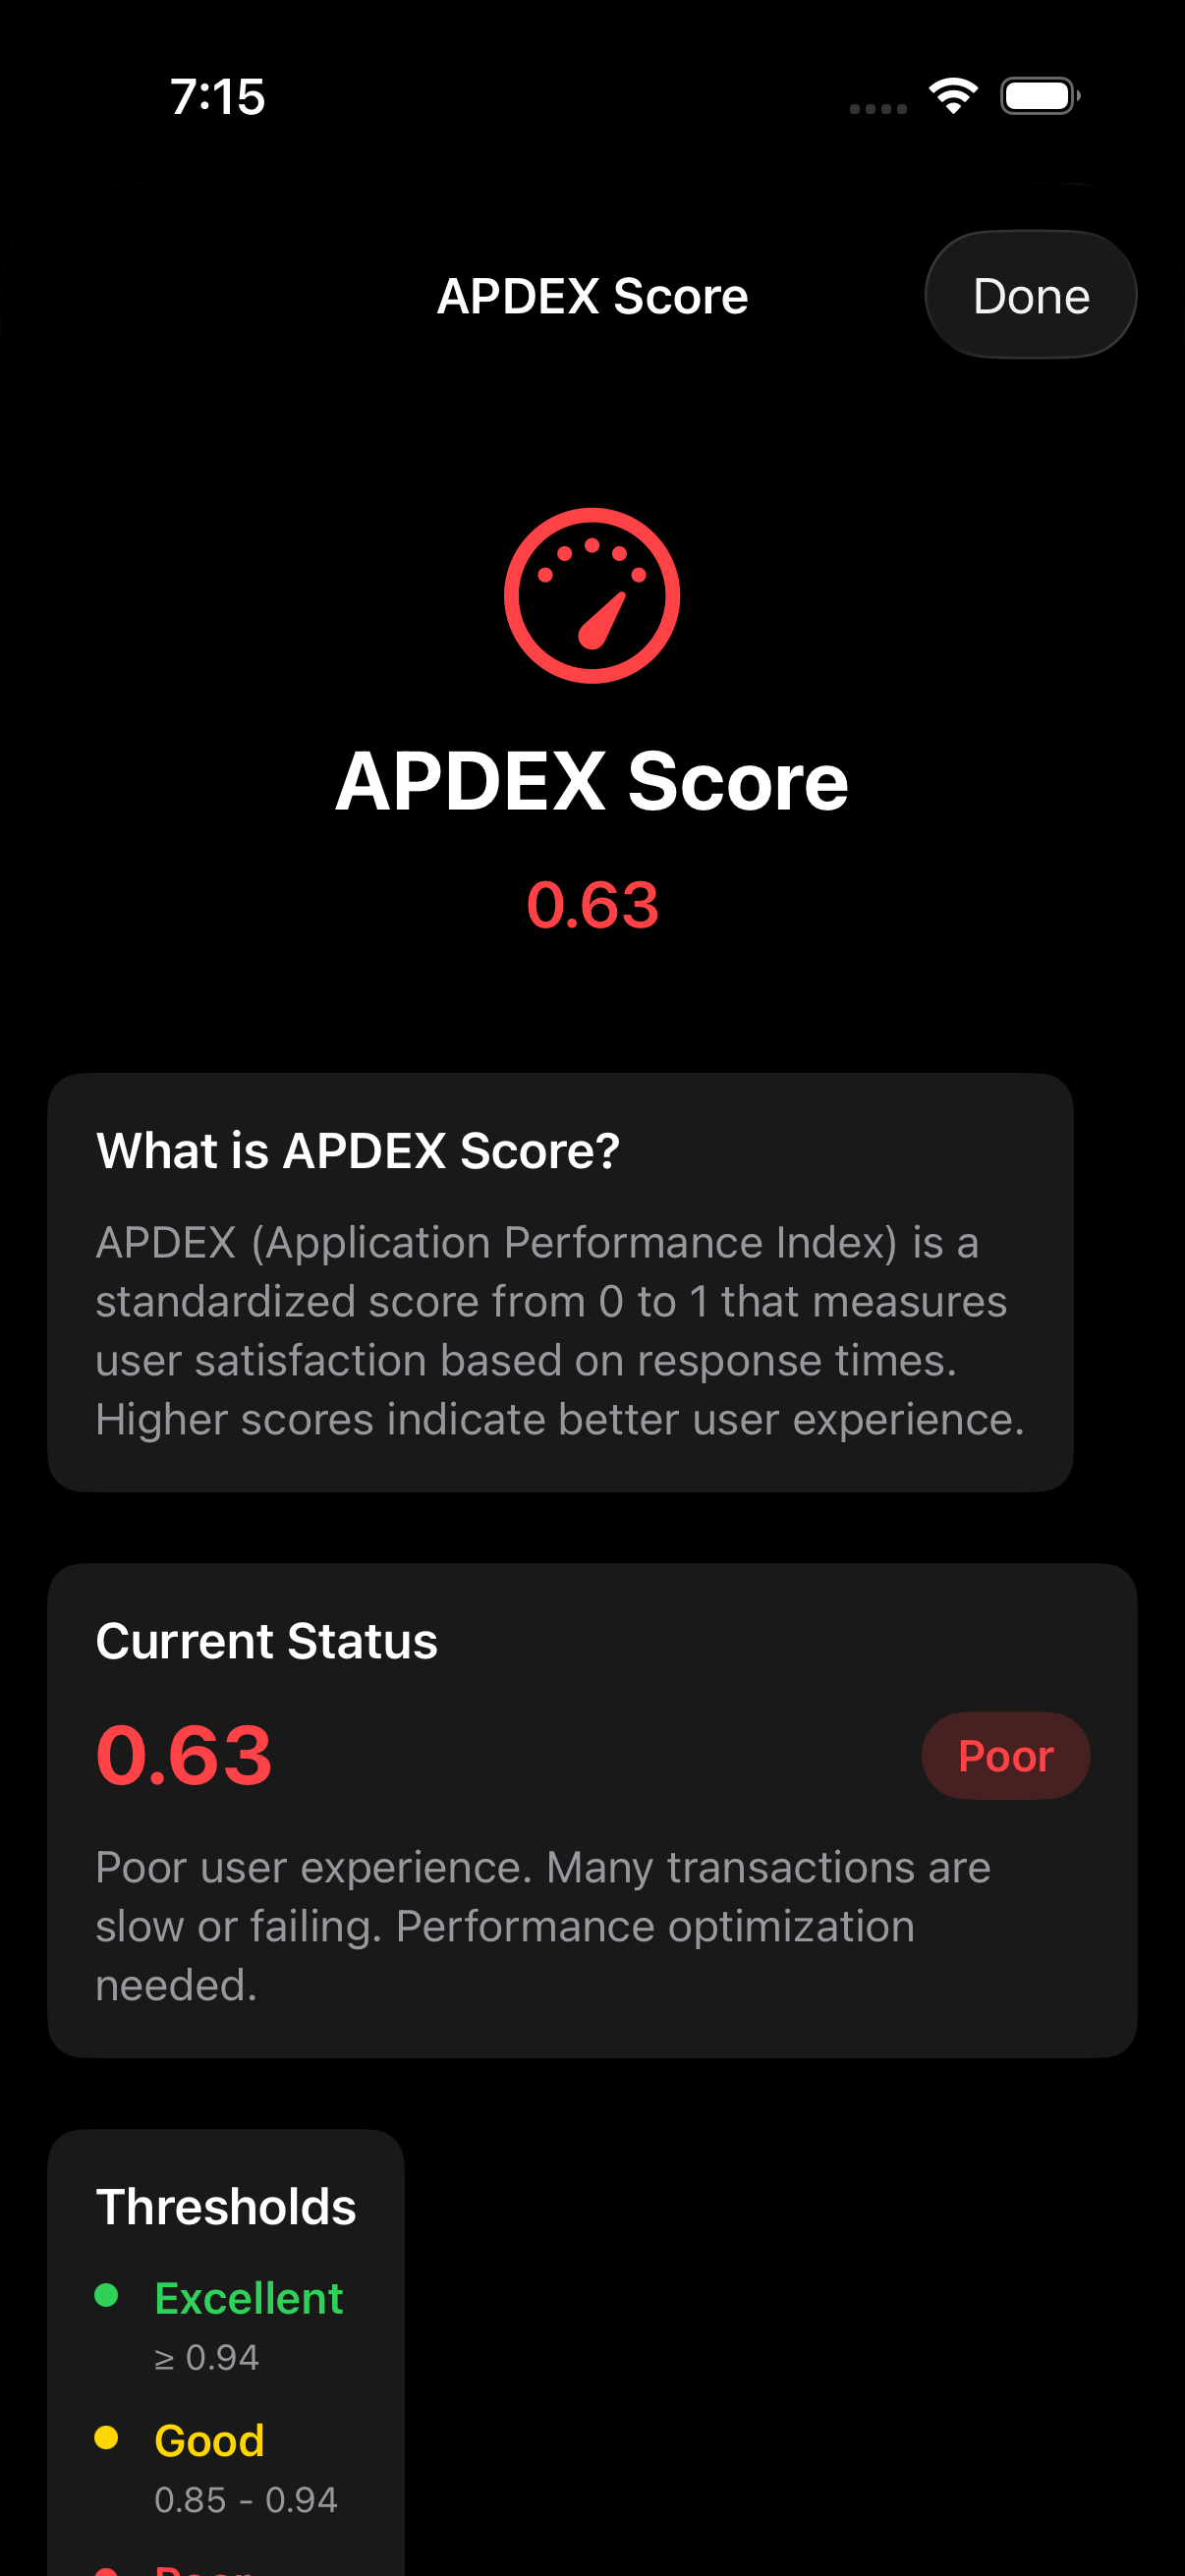
APDEX Score
Interactive APDEX score explanation with detailed thresholds and performance recommendations
Traces
APM trace summaries showing average and P95 latency with error rates for all endpoints
Service Metrics
Service-level metrics including CPU, memory, latency, and error rates
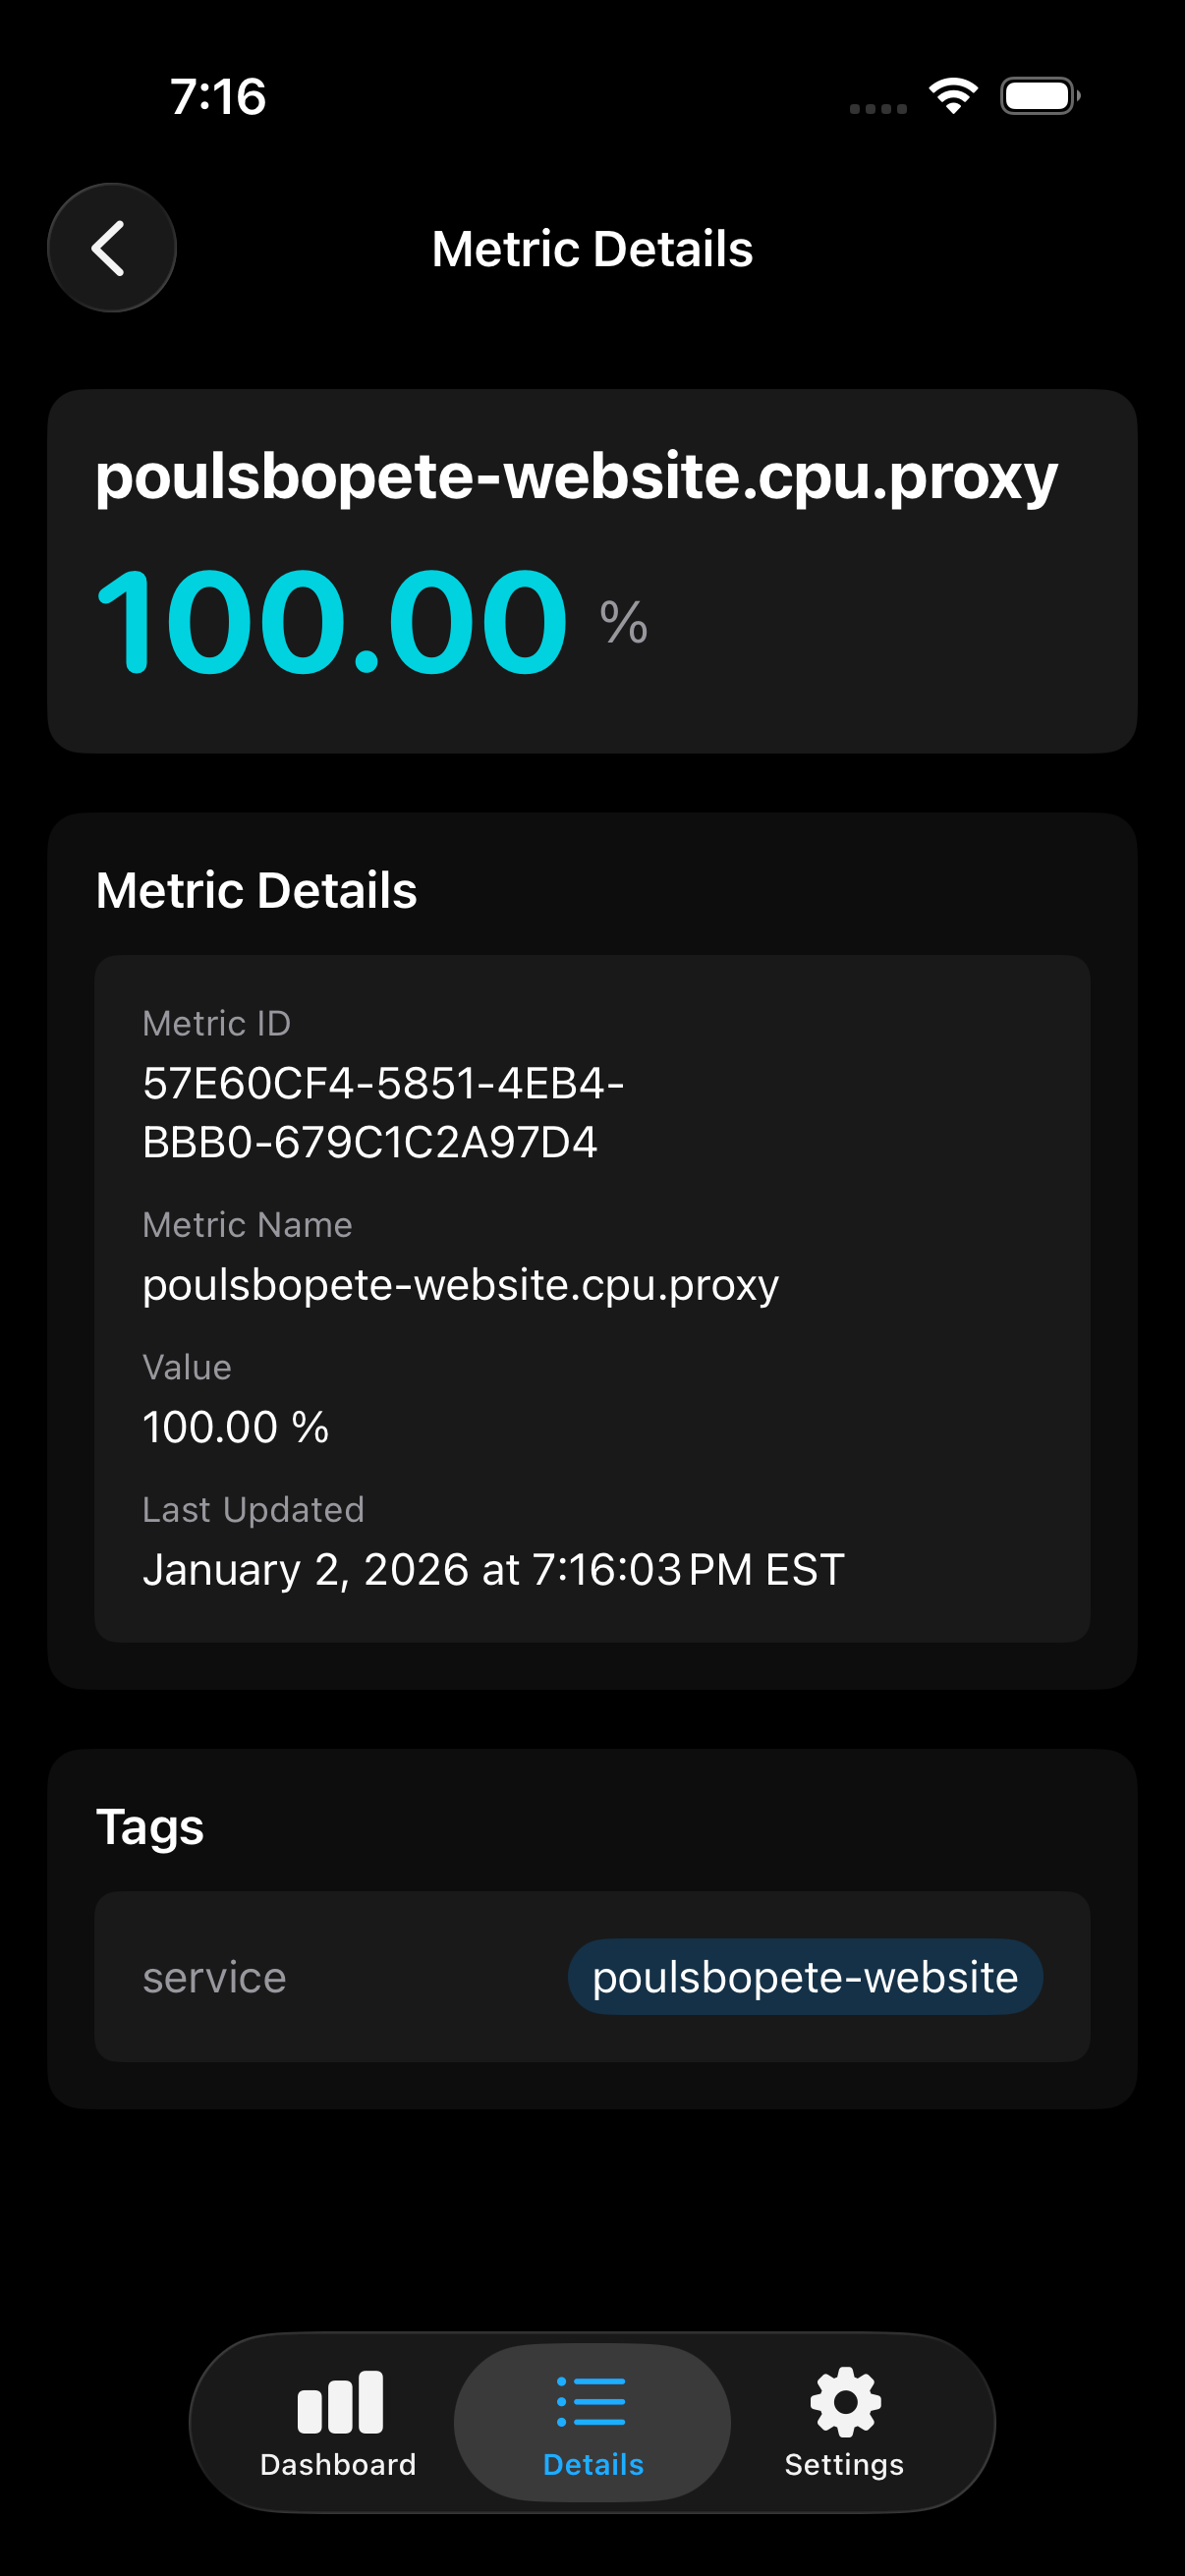
Metric Details
Drill down into individual metrics with full IDs, timestamps, and service tags
Logs
Recent error and info logs with service context and timestamps
Workflows
View workflow executions with IDs, types, and execution timestamps
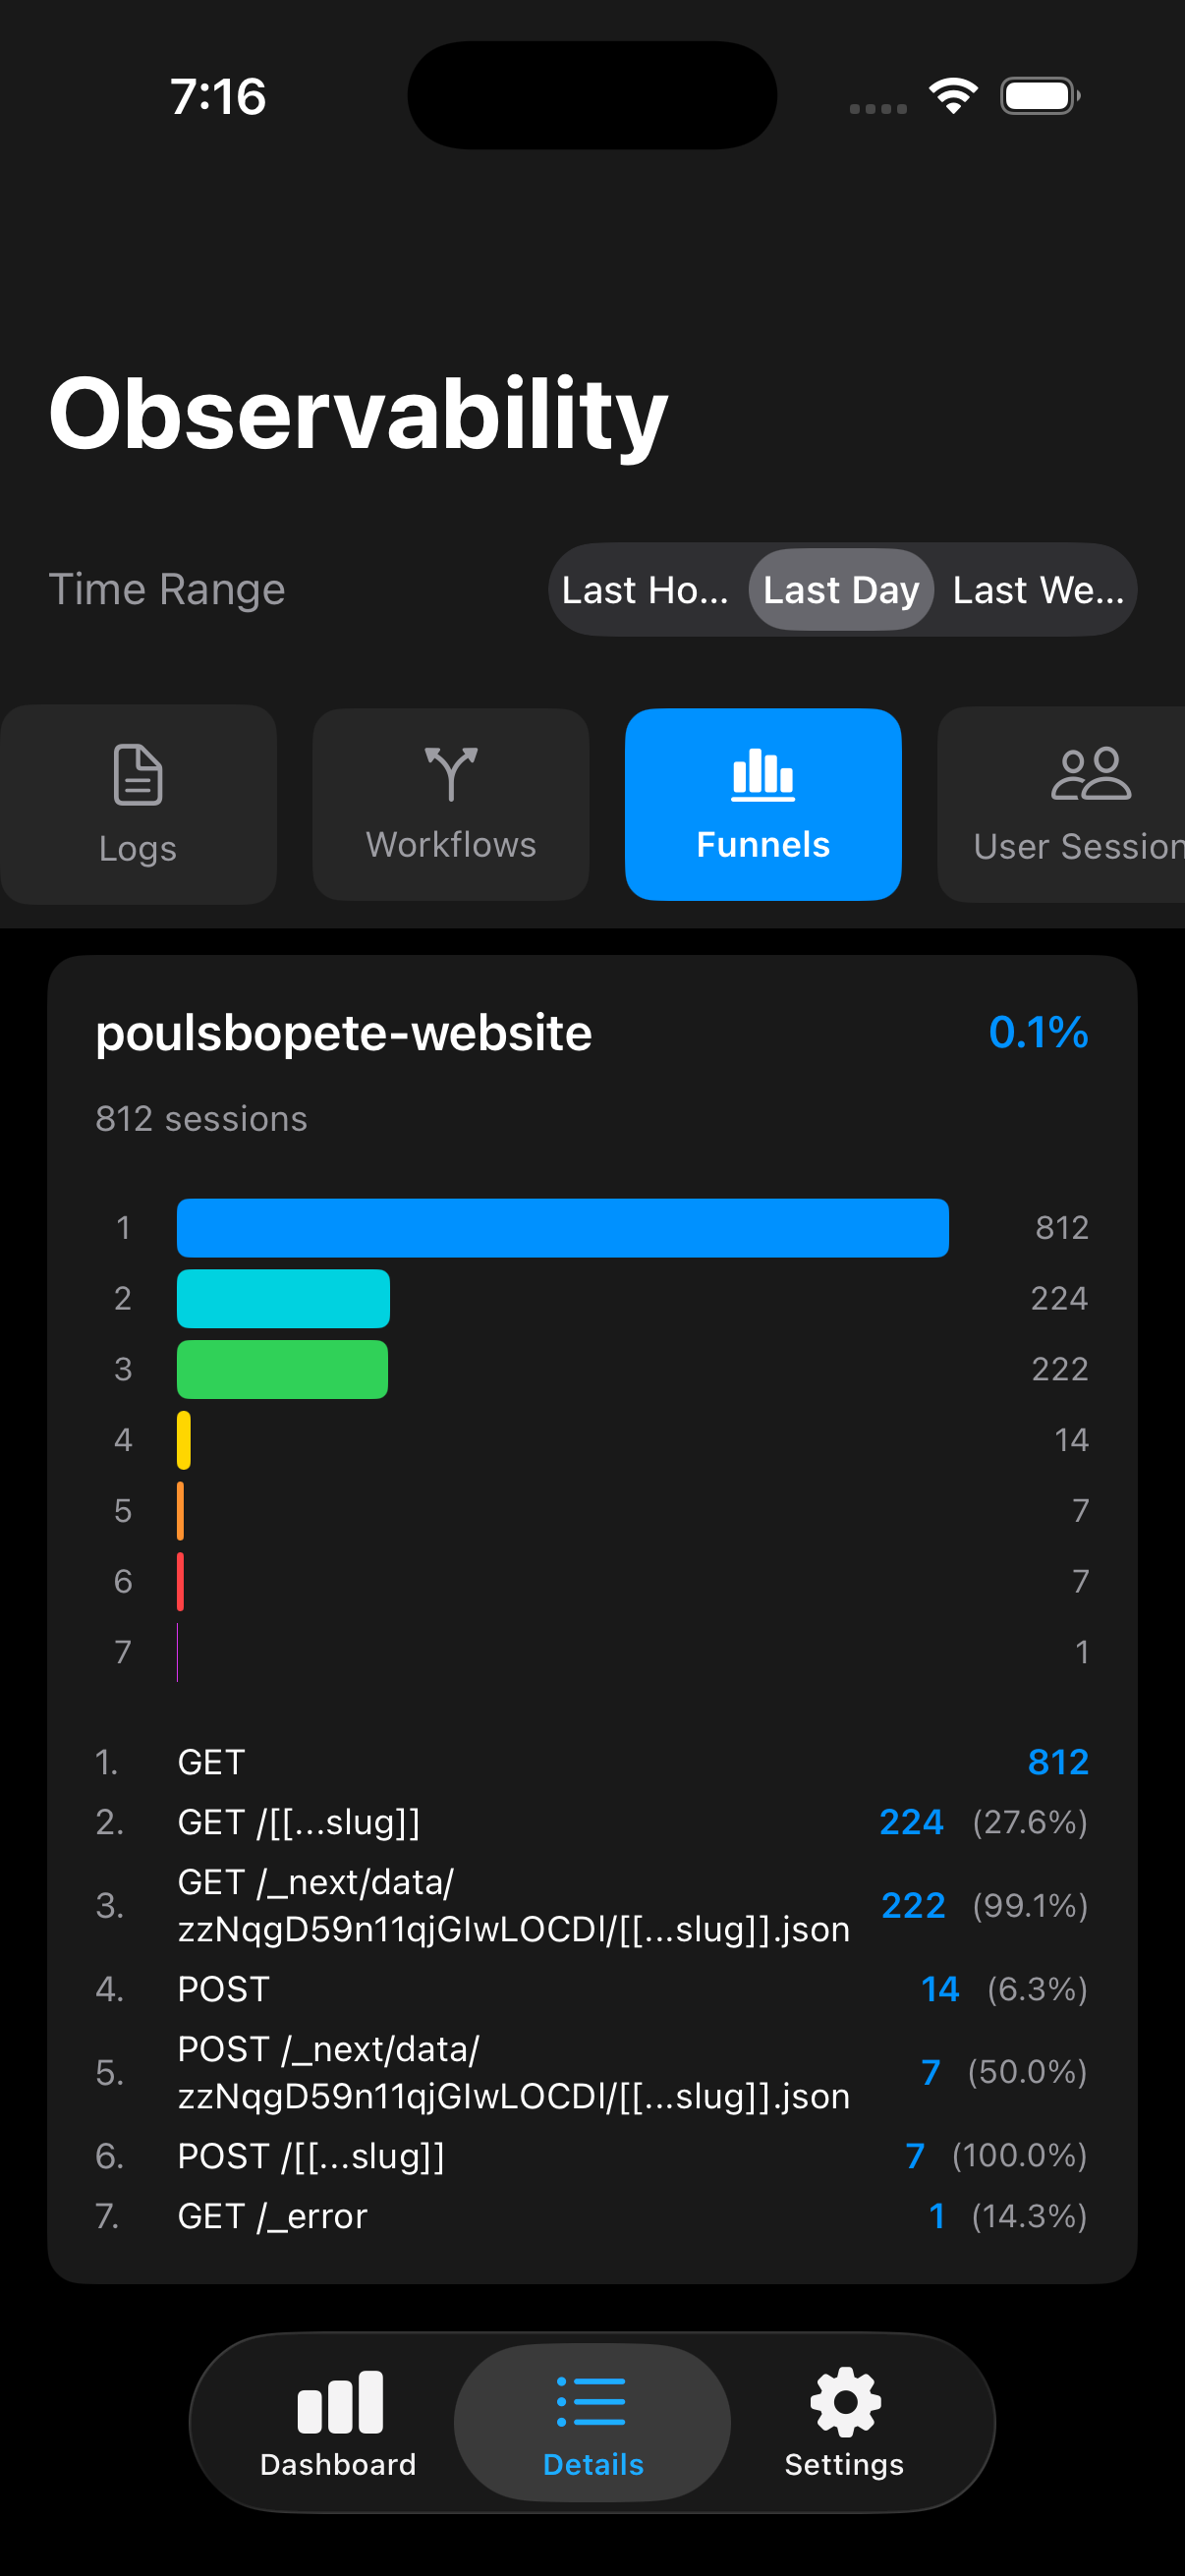
Funnels
Visualize user journey funnels with conversion rates and step-by-step breakdowns
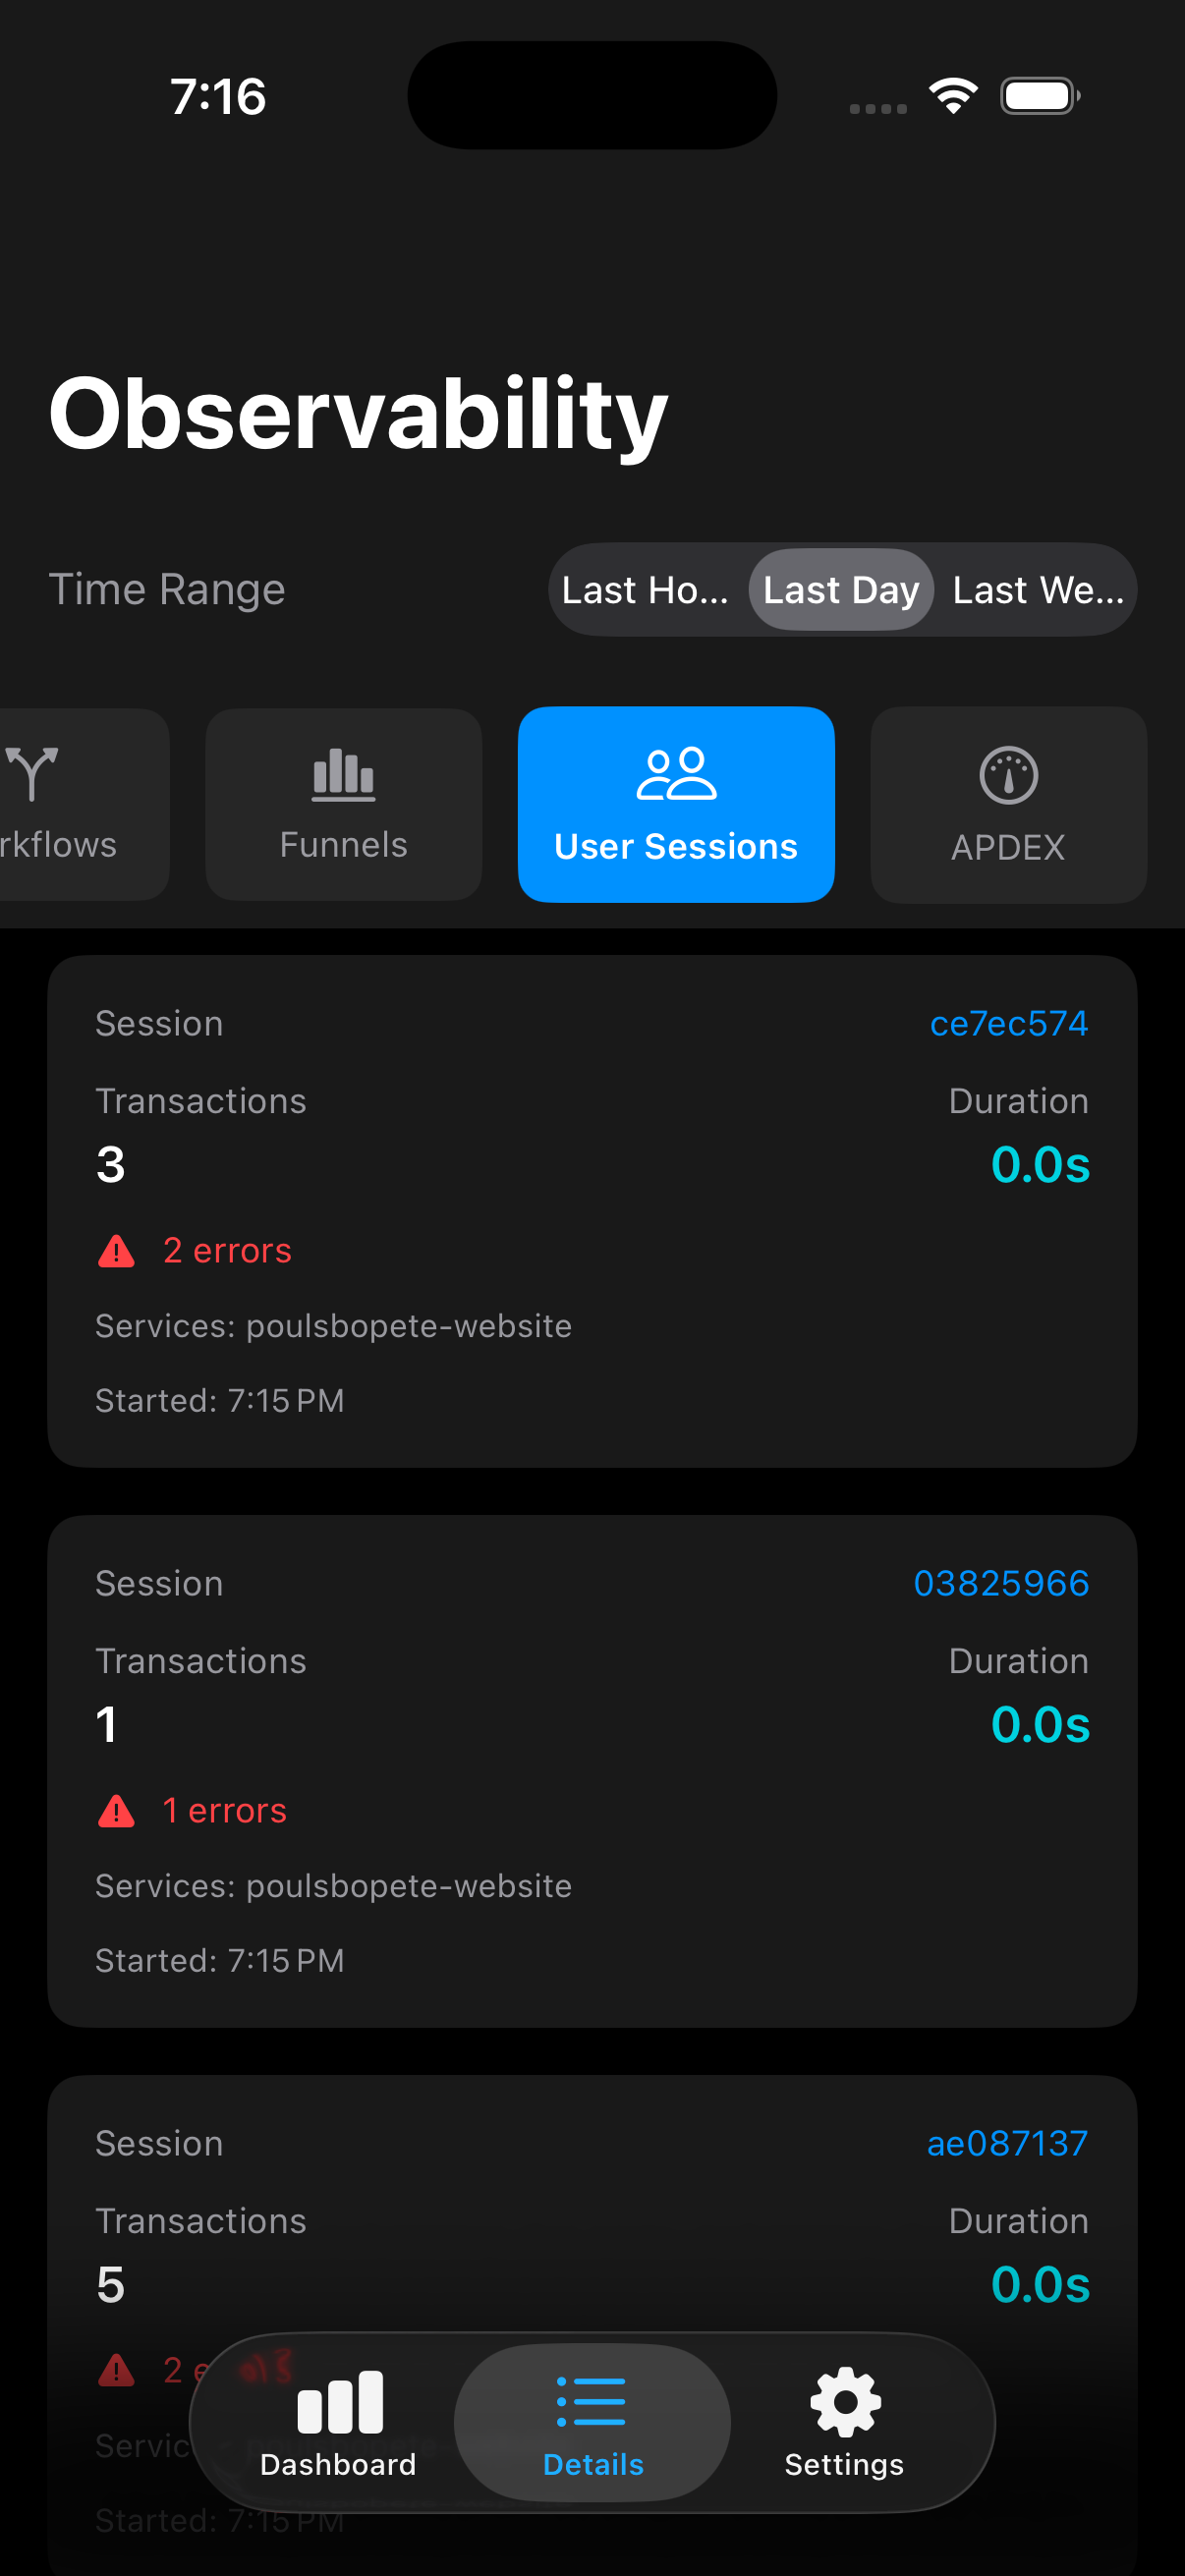
User Sessions
Track individual user sessions with transaction counts, errors, and durations
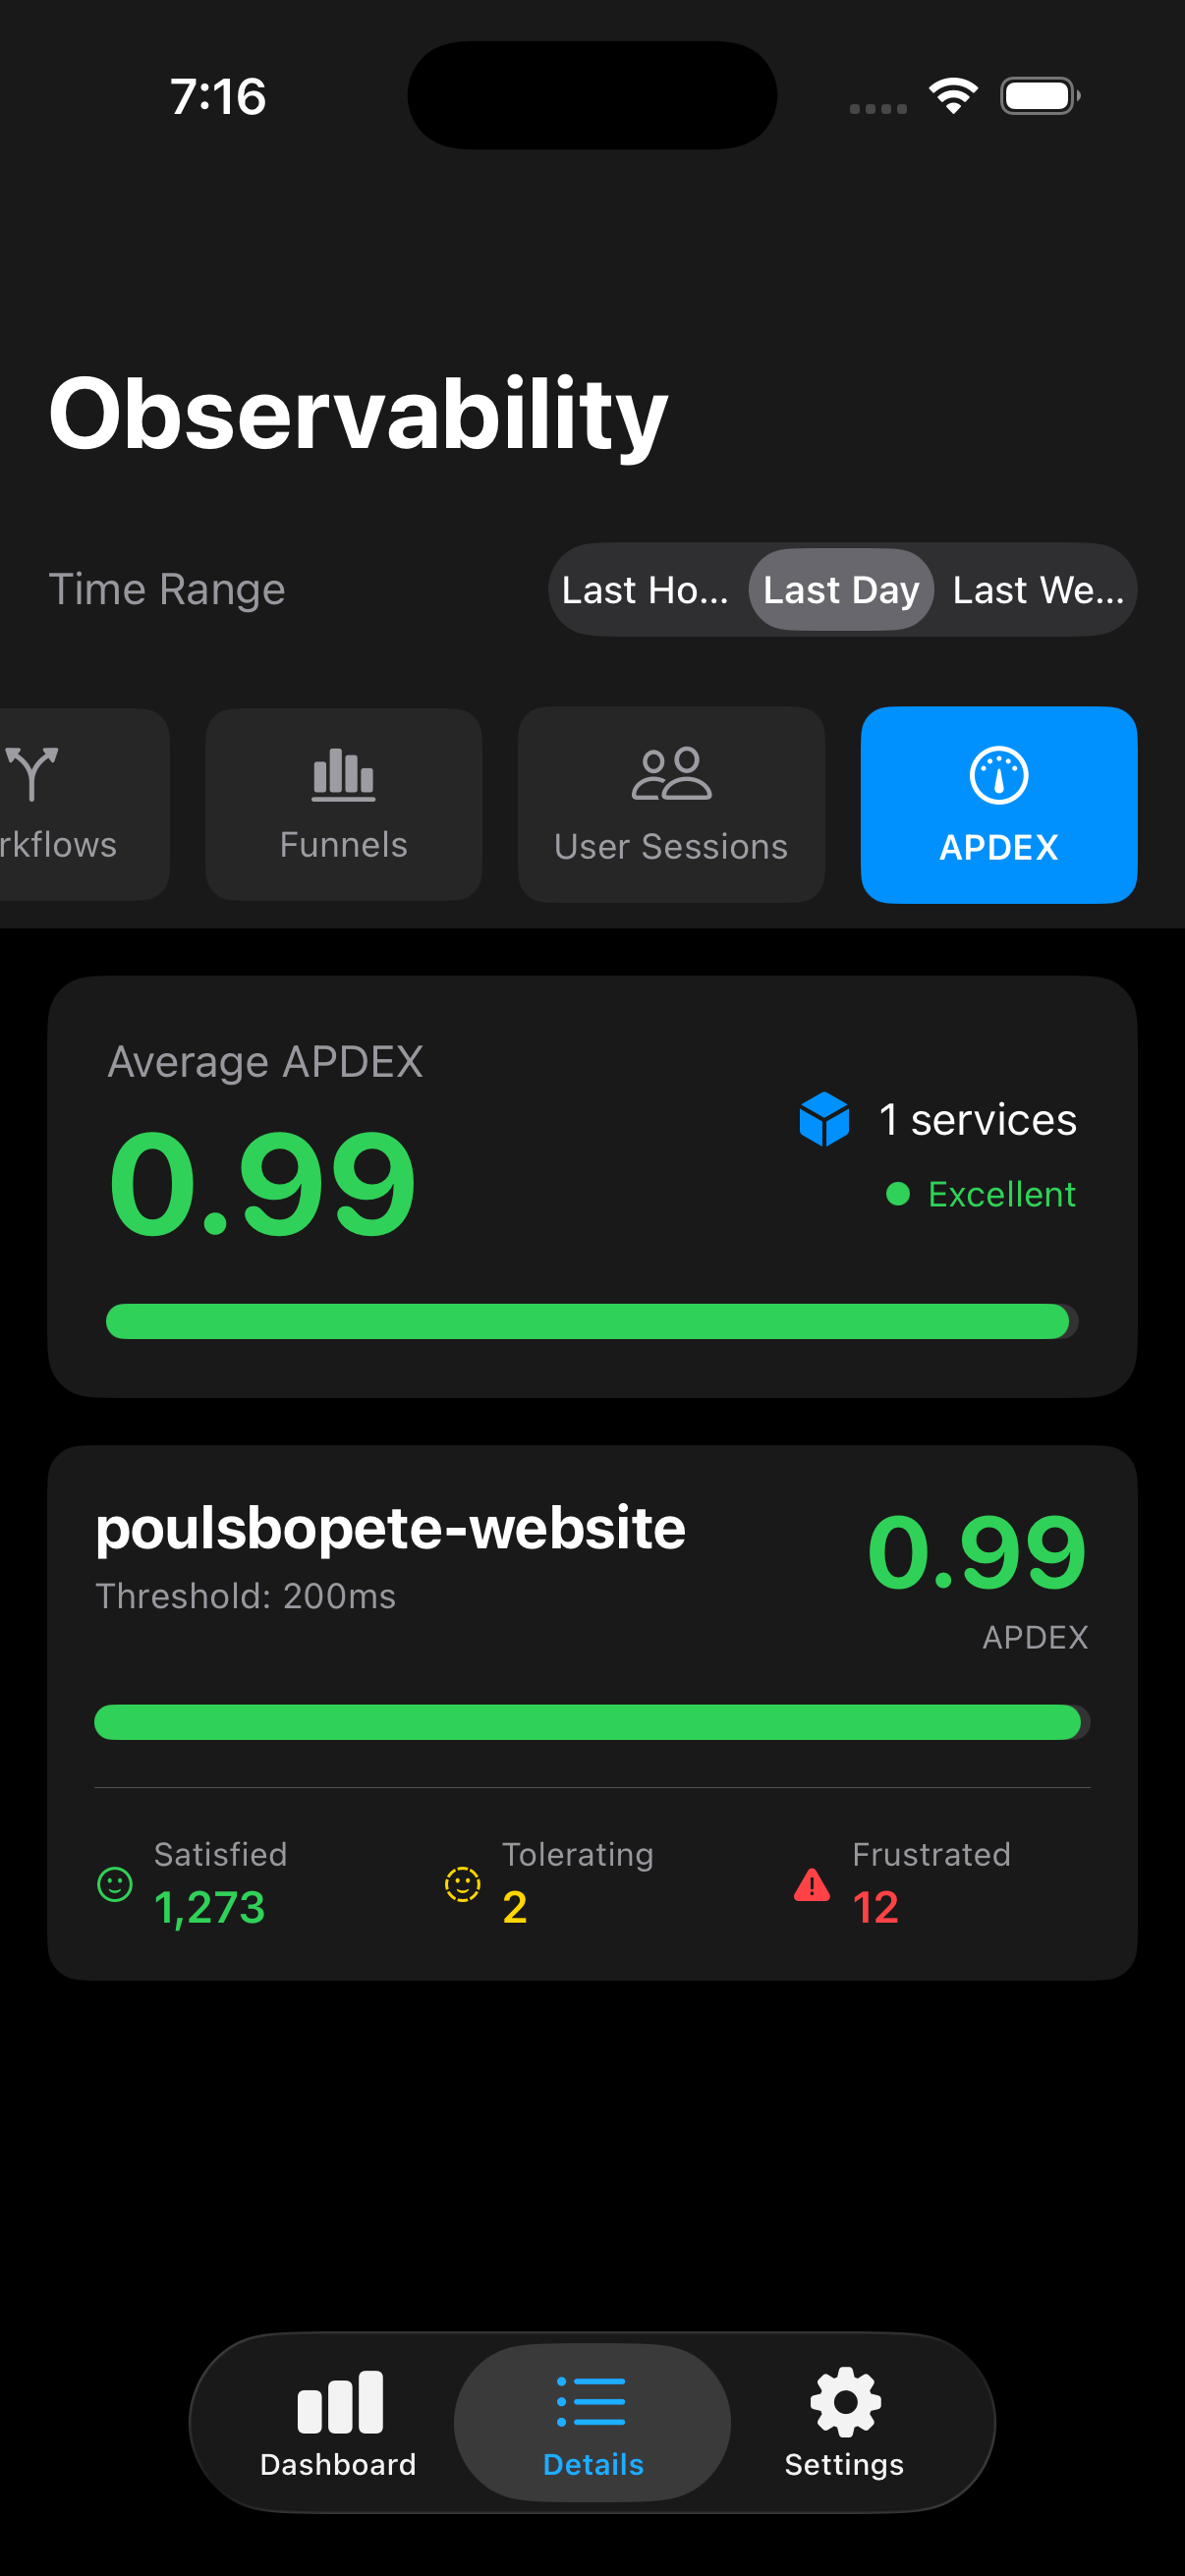
APDEX Overview
Average APDEX scores across services with satisfied, tolerating, and frustrated user counts
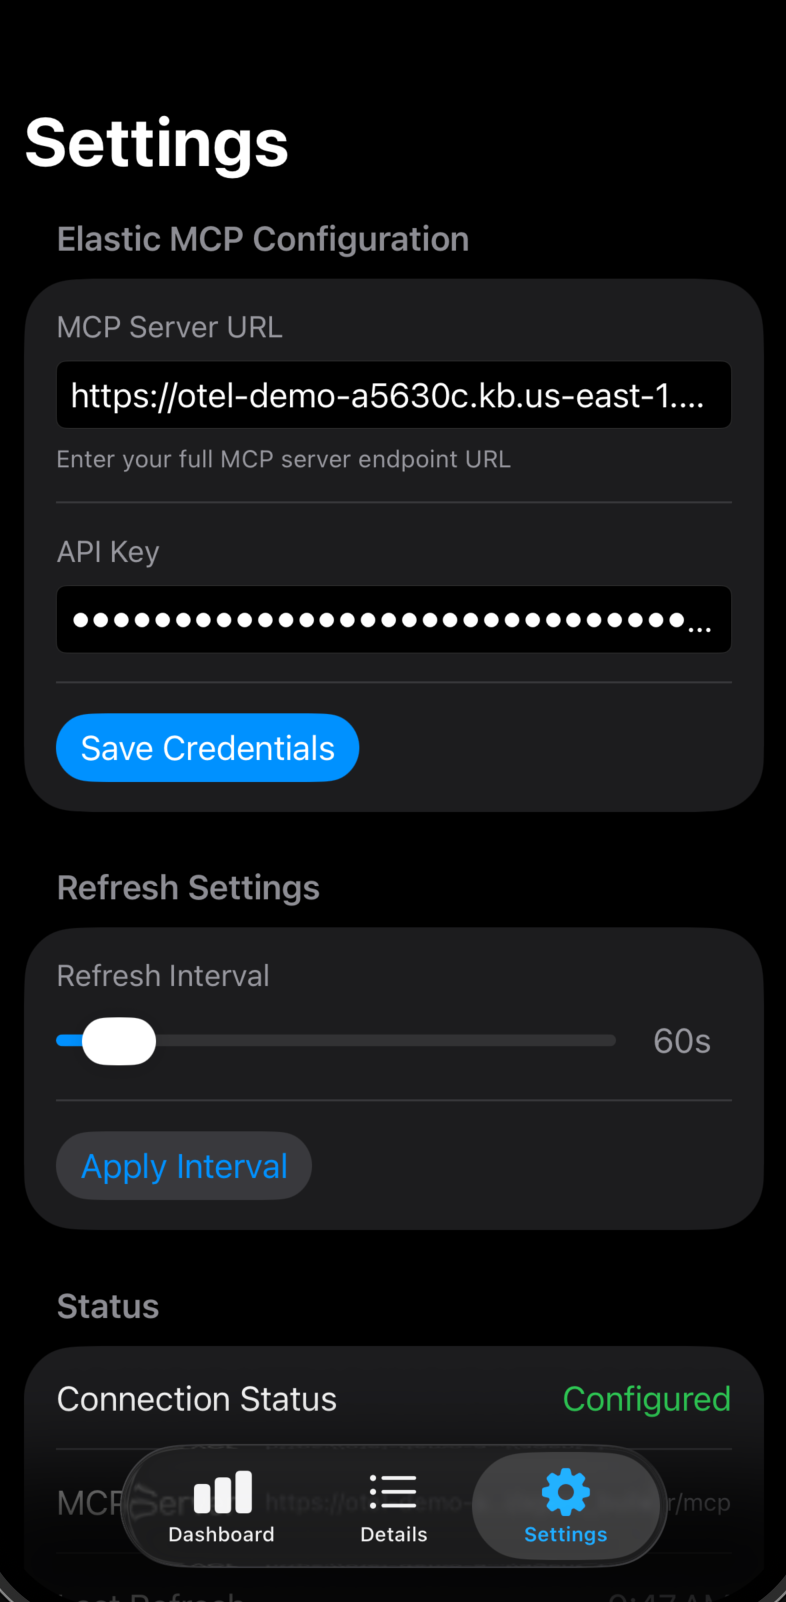
Settings
Configure MCP endpoint, API credentials, refresh intervals, and connection status